12 Years Of Brutal Options Trading Advice In One Course
Now Playing
12 Years Of Brutal Options Trading Advice In One Course
Transcript
2386 segments
Most traders spend years trying to get
consistently profitable. I bet you watch
so many different videos, switch
strategies, tried to learn these crazy
setups, and honestly, it might still not
be working for you. You still can't
consistently profit in the market
reliably. So, in this course, I have a
meticulous, curated, a perfect
step-by-step road map showing you
exactly how I personally have managed to
become a consistent, profitable trader,
and have grown my portfolio to $4
million with regular stock trading and
primarily option trading. I'm not
promising any results. I'm not allowed
to do that on YouTube. And of course,
trading can be risky, but I'm going to
be showing you all of the inside
secrets, all of the inside strategies,
all the knowledge that I've have had for
the last 12 years that has helped me
personally retire, as well as a couple
thousand of my students. And I'm going
to share all of this for free. Of
course, trade at your own risk. This
video is for educational purposes only.
On the screen right now are a list of
timestamps and chapters that I will go
through in this course in showing how I
got into option trading and became
consistently profitable. Now, for me,
this is a deeply personal topic because
finance really controls our lives. When
I was 19 years old and I had $2,000 in
savings, I decided that during that
internship, I was going to learn
everything that I could about options
because I saw that the option traders
that I was working with were making like
$10,000 a day. And I thought $10,000 a
month was something that I would never
even achieve in my life. Once I got my
portfolio to $50,000, that's when I
really saw that my portfolio started to
skyrocket because money was finally
working for me. like getting to $50,000
took a lot of time and honestly a lot of
mistakes as well. Now my portfolio is in
a good place where at $4 million it's
actually well above what I even need for
a consistent retirement income. So I'm
glad to officially announce that in my
early 30s I am able to retire and live
in different countries and have a more
freedom based lifestyle. So I'd love to
help you in this course and I think this
course is going to change your life. An
option is just a contract that gives you
the right but not the obligation to buy
or sell 100 shares of a stock. So
there's two main types of options. Call
options, which I'm showing you right
now, and put options. Every option
contract usually controls 100 shares.
That is always a constant. Now, options
have an expiration. So, as we see here,
I'm using the August 21st expiration.
So, they do not last forever. All
options eventually expire. You just get
to pick the expiration date. That's
really cool because as an investor, you
get to make a bet and then you also get
to choose a time frame that works for
you based off of your view. So, let's
say that, you know, Apple is trading for
$270 per share and you sell a $260 put
option, that means that, you know,
someone is betting that the stock will
go down because if you buy a put option,
you're betting it going down. If you're
selling a put option, that means you're
betting on it not going down. Okay? And
if you sell a put option, for example,
you collect income. If you buy a put
option, you are spending money to buy
that option. So you are paying what's
called a debit. So there's debits and
credits. Debits is basically when you're
paying and a credit is when you are
receiving. Whenever you're buying
options, it's a debit. And then whenever
you're selling options, it is a credit.
So by the way, selling puts is one of
the two passive income strategies that
you're going to learn in this video.
We're going to start off with buying a
call option. And I'll explain to you how
this works. And then we'll go into the
passive income strategies that I
personally like to use in my own
portfolio. So, here's what a buy call
option is. Let's say that, you know, we
think the stock is going to run further
on American Airlines. If you buy an 18
call option right here, that is your
strike price. You want it to go above
18, the premium that you pay, this $130
is basically the premium that you have
to pay a debit for. Okay? So, if you pay
this debit and your strike price is 18,
your break even price is going to be
$19.30.
Okay? So, if I click into this option
now, you will see some statistics on
this option. You can see the mark, the
previous close, the chance of profit.
And by the way, the chance of profit is
based off of delta. Typically, here it's
very different. So, I would go with
delta. Okay, what is delta? Well, delta
is basically two different definitions.
They're both pretty easy, so write this
down if you have to. The first
definition of delta is that if a stock
goes up by $1 and delta is 0.5, like
with this example right here on American
Airlines, that means that for every $1
move in the stock, the option will move
50. So the delta basically tells you the
sensitivity of how much this option is
going to move. So if it's 70 delta, then
it's going to go up.7 cents per $1 move
in the underlying stock. Now another
definition of delta is the chance that
the option will expire in the money. And
that's why this option right here, which
is really, really close to what American
Airlines is currently trading at, has a
delta of 49 or basically 50 because it's
right there. So there's basically a
50/50 chance. So options and trading is
pretty interesting because at the money,
right, when a stock is right at the
money to the strike price, meaning it's
very very similar in price, you don't
really know what direction, right? So
the option market assumes we don't
really know too much direction. Now, in
some cases, of course, there's a
something called a skew. So an option
could be worth more. For example, a call
could be worth more than a put, but
typically it is going to be a 50 delta
if it's right there at the money. So, a
$20 stock that's trading at $20 and you
buy a $20 call option, it'll have a 50
delta. A put option that's also at $20
will have a 50 delta because the option
market is typically not taking
direction. Okay, it's assuming that
there's a 50-50 chance that the stock
will go up or down. That's pretty
interesting and pretty cool. So, here
there's about a 50% chance that American
Airlines will be 18 or or higher, right?
So, as the stock goes higher, this call
option benefits. It gains value. So the
break even is going to be the strike
price plus the premium that you pay and
then you start making money above that.
However, that assumes that you hold this
option until expiration. You can always
trade options before before they expire
really. So if you buy an $18 call option
and American Airlines starts to go up
and it hits $18 per share, this call
option could be worth more. It could be
worth a good deal more because currently
it's trading for $1741.
So if it goes up, you know, by 60 cents
on the stock, well, this option might
gain, you know, half that value, 30
cents, right? Because of delta, again,
going back to delta, it's 50. So here,
this option could increase by 30. And
although that might not seem like a lot,
the 30 cents increase would be against
the premium that you pay, which is $130.
So a 30 cent increase on a $130 is
actually a pretty large move. It is a
very large move in terms of percentage.
Okay, so that's the benefits of a call
option is when the stock can move a
little bit, the option can move a lot.
And that is why a lot of option traders
really like call options. That's also
why a lot of beginner option traders
look at buying call options because it's
one of the easier ways to make a bet if
you have a certain view, right? So, if
you have a certain view on a stock going
up and you don't have all the capital
for it, well, a call option lets you use
less money, less capital upfront to
still control 100 shares. That is one of
the biggest benefits of a call option.
So, if you wonder why are options so
good and how investors make a lot of
money from them, well, it's really by
having a strong view on a stock and then
buying a call option and basically
betting that, hey, this stock will go
up. The call option that you buy is
essentially a leveraged bet because if
you think about it, if you had to buy
American Airlines in this example, you'd
have to pay $1,700 to buy 100 shares.
But in terms of premium, it's only 130
bucks. I mean, that is a lot lot cheaper
in terms of upfront capital that you
have to put up to control the same
amount of shares. That's exactly pretty
much what a call option is. Now, I want
to move into another strategy because
the next strategy is essentially a
passive income strategy. This passive
income strategy is one that I have used
in my portfolio for the past 10 years.
And this is an idea of being able to buy
stocks below their current market price
and collect a premium for it. This is
going to be a very different strategy.
So, I'm going to um exit out of this buy
call option. I'm going to go to sell put
option. Now, when I am looking at
selling a put option, this is very
different. So, remember, if you are
buying a put option, you're betting on a
stock going down. If you're selling a
put option, you are betting on it not
going down. So look, sell put option. If
I sell this $17 put option, what this
means is if American Airlines goes from
1741 a little bit down, but it stays
above 17, then that's actually okay.
That would still mean that this is an
out ofthe- money option. When I sell a
put option, I'm saying it won't go down
below my strike price that I choose,
right? So if you choose a 17, well, the
stock can slightly go down until 17. And
then at 17 you start to lose money. But
because you collect a premium here, you
can see $122. This is actually a credit.
You are collecting income off of this
trade. So when you sell this put option,
you collect this income. Then your break
even is not really 17. If it goes below
17, you have the risk of getting
assigned early, which typically doesn't
happen. You have a high high risk of
getting assigned at expiration. If it's
below 17, you almost have 100% chance of
risk to get assigned. Now assignment is
not always bad. Many people think that
assignment is bad. However, when you
sell a put option, you can use this as a
dual strategy. You can use this as an
income generating strategy where you are
looking to collect premium. And then
number two, you can use this as a
strategy to enter a stock that you want
to own for a lower price. So the idea of
buying stock below their current price
is this strategy right here, selling put
options. Again, if you sell it upfront,
you collect premium and now you have the
obligation to buy at $17 or lower if it
goes lower. Okay? So, if it goes to
$16.99,
you're in the money now. However, you
still have a gain total because the
premium that you collect is a lot more
than being in the money by, you know,
one penny essentially. So, your break
even here is $15.78.
It's slightly off on Robin Hood. says
76, but the premium if it's 122, you
just do 17 minus $1.22, which is going
to be $15.78.
So that is your break even. And this is
a strategy that I have used for the last
10 years to simply buy stocks that I
want to own. Now, it's very important
that you don't mind owning these stocks
whenever you sell put options.
Otherwise, you are more in that risk
territory where if it does go down, you
may end up losing on the position,
having to close this position because
you don't want to get assigned. But if
you do want to get assigned, then this
is, you know, a pretty good situation to
be in overall. So, here's some more
terminology that you might want to know.
So, call options versus put options. You
can basically buy or sell a call option,
and you can buy or sell a put option.
These are only the four things that you
can do in option trading for the most
part. You can also combine calls and put
options, but that's more of an advanced
strategy. Simply, if you're a beginner
and you want to make a bet on a stock,
you would buy a call option. If you want
to make a bet on a stock going down, you
would buy a put option. If you want to
generate more passive income and sell a
put option and wait until that option
expires, collecting the premium while it
decays, that is a selling put strategy
and that is a more passive income
strategy. I'll show you an example of
another passive income strategy in a
little bit. The most important
terminology that you need to know is
strike price, the price that you agree
to buy or sell the stock at. Premium,
the price that you pay for the option or
the money that you collect if you sell
an option. Expiration date, the date of
the contract when it ends. Then in the
money, the option is profitable or has
value if it is in the money. Out of the
money is when an option is not
profitable yet. But if you're selling an
option and it's out of the money, that
could be a good thing. If you are buying
an option and it's out of the money,
that is not a good thing. So out of the
money is just referring to the price of
the stock not being within the value of
the strike price that you have. So on a
call option, if you buy a $100 call
option and the stock goes above 100,
you're in the money. If it stays below
100, well, you're still out of the
money. And then there's a term called at
the money, which is not that useful. It
just basically means when a stock is
right at the strike price. So now I want
to explain to you my option strategy
here because again, my goal here is not
to gatekeep. I want to give you all the
knowledge that I have in short amount of
time as possible to give you the most
amount of value. So first of all, I look
for stocks with good support levels,
meaning the stock has already dropped or
is holding a price level where I feel
comfortable buying this stock or trading
this stock. That's a really important
point to find support levels where
stocks are cheap. If you trade expensive
stocks, well, it's much harder to make
money when stocks are expensive, and
it's much easier when they're cheap.
Next, I choose options with good
liquidity in a tight bid ask spread so
you don't lose much money whenever
you're trading them. So, let me show you
what bid ask spread is and why it is so
important. If I go to another stock,
which is going to be Nebius, this is an
Neocloud company essentially. It's an AI
revolution story. I have 100 shares
where I made really good money. But I
want to show you if I trade options here
and I go for an option with an
expiration of July 10, for example, and
I go down somewhere and I'm looking at
selling a put and I look at 250, you can
see here that the bid, okay, up here it
says bid $20.95
and ask $22.80.
Okay, so what this is is essentially a
spread difference of someone looking to
buy and someone looking to sell. It's
basically like a market, right? You're
looking at this as a market. So think of
it kind of like gas, okay? Okay, someone
is trying to buy gas at, you know,
$20.95 and someone wants to sell gas at
$22.80. So obviously this buyer and this
seller, they're really not that close.
Okay, so this would be an example of a
illlquid option where the bid ask spread
is wide. Okay, this is a wide bid ass
spread. Not that good because every time
you trade you are losing money here and
this is a very very big difference. You
can also notice here there is a term
here called mark. Okay, so what is mark?
Mark is essentially the middle point
between the bid and the ask. So you see
the mark is $21.88.
This is the middle point where you would
likely get filled on a trade if you were
to enter one. Right? So if you buy or
sell, you're likely to get filled at
$21.88.
You always want to choose options that
have better liquidity. So if I go to
Apple right now, you will see that a
huge mega cap stock that is, you know, a
lot safer, Apple is going to have a very
tight bid ass spread. And simply what
makes a good bid ask spread is when
there's a lot of volume. So if I go
right now to July 10, which is the same
thing I was looking for at on Nebius and
I open up 285, you can see here the bid
ass spread is a lot tighter. So it's
$253 and then the ask is 269. So that's
a much tighter spread here. It's a very
small difference. It's not too small.
It's $16, but essentially you're only
going to be losing half that because
you're going for the midway point
whenever you're filling an option. So,
you're going to lose about $8, which is
a lot better than losing like, you know,
over $100 on the other trade that I
showed you. The next thing is really
just using delta. So, I personally use
delta to estimate assignment risk. So,
here, if I were to sell this Apple put
option, right? Let's say that I wanted
to create some passive income. I sold
this Apple put option at 285. Apple is
trading for 291. So up until the
expiration, I don't really need to do
anything. I'm just selling a put option.
Then I'm hands off. I'm just like, hey,
let me wait and just see what happens.
If it goes down a little bit, that's
fine. If it goes into the money, then,
you know, I have to decide, do I want to
get assigned? Do I want to maybe adjust
the position a little bit? Do I want to
close the position? Right? But
essentially, as long as it's above 285,
I don't need to do anything. And my
decision-making process to get into that
trade, right, to begin with, hey, should
I sell this put option? And how much
risk is this? Well, that's delta. So, it
would be 27 delta here, which means
there's a 27% chance of this happening.
And if there's a 27% chance of this
happening, that means that there's a 73%
chance of this not happening. Or in
other words, there's a 73% chance that I
just sell this put option and it just
expires worthless, which is a good
thing. If I'm selling it, I'm collecting
the premium. I want it to expire
worthless. Right? If you're buying
options, you don't want it to expire
worthless because you're paying and then
you hope to get out with more than what
you paid. So, my basic trading strategy
is sell puts for passive income, wait
until expiration, and then either keep
the premium, which I'm going to keep it
anyways, whether it's in the money or
not, and accept the assignment, or don't
accept the assignment, and basically
either adjust it or just close it out.
Now, if assigned shares, I either hold
the stock longterm because now I have
the shares, right? So, in this example
right here, if Apple goes down to 284
and it's 7:10 on expiration date, right,
at 400 p.m. Eastern, well, the stock
market closes and then I'll essentially
be assigned shares. Then I will have 100
shares of this stock. So, at that point,
I'm either going to wait and hold on to
the stock or I could just continue to
generate income, which is the next
passive income strategy. The next
passive income strategy, the second one
is covered calls. A covered call is when
you sell a call option generating income
on a stock that you currently have right
now. So if I get assigned, then I have
100 shares. 100 shares gives me the
ability to sell call options. So what a
call option would look like, let's say
that I got assigned on Apple, right? So
I have Apple shares now and I want to
sell a call option. So I go to sell call
option. I pick an expiration date here,
July 17. If you're watching this in the
future, this is basically just a
tutorial of how you can option trade
yourself and learn from someone who's
been doing it for over 10 years. So, you
know, feel free to just do this in the
future knowing this knowledge now. So,
look, if I have 100 shares, I can now
sell a call option. So, I can sell a
295, which would be an out of the money
option. It's more expensive than the
current value of Apple, which is 291.
So, at 295, I sell that, right? And now
I can collect $650 worth of premium. So,
if I go into this option right here, you
can see the bid ask is really good. And
the delta here is 48%. So there's a 50%
chance, a little bit higher than 50%
chance that nothing happens. I just
collect the premium and it expires
worthless. Now there's a kind of 48%
chance that the option goes in the
money. And that's not a bad thing
because when you sell a call option, you
are essentially giving the rights to
someone else to buy the stock from you
at that price, right? So if you have an
average cost at 290 and you sell a
covered call at 295 and you generate
premium income, okay, and it goes above
295 and you have to get rid of it, was
that a bad thing? Well, I would say no.
I would say it's not a bad thing because
if you bought at 290, you sold it at
295, you have profit of $5 plus not to
mention the premium. So the premium here
is going to be $6.50. So in total in
this example, if you have Apple at 290
and if it goes to 295, you get $500
worth of capital appreciating, right?
How much money you make off of the
capital appreciating and then the
premium is still yours. So 500 plus 650
you have 1150 in total kind of profit on
this trade example on Apple that expires
on July 17th right so you can also do
you know something more shorter term a
lot of people like weekly options so
weekly option would be something that
expires within one week right so if it's
July 1st you go for July you know 7th
for example you can go shorter term
weekly options generate premium more
frequently but require more active
management so while monthly options are
more passive and I personally love
monthly options because it's it's a very
passive income stream that I have made
for myself by just selling a you know a
call option or selling a put option.
This is exactly what I teach in my
community. I pick a high quality company
that's very important and then I sell
options on those positions. Now higher
returns are possible when you buy
options. Higher returns are possible
because you're spending money. you're
putting up a little bit amount of money
and then if the right direction happens
on the stock then that option could
increase a lot in value versus when you
sell options you have a very fixed kind
of return you have fixed income in in in
a in a way because if you sell something
like this Apple option here for you know
$650 so if you sell this you know
short-term Apple call option for $295
you know basically that's $325 that's
that's that's it you can't make more
when you sell an option you can't make
more than the premium that you sold it
for right that's what you sold it for.
That's your kind of max gain. Whereas,
when you buy an option, well, there
really isn't such a thing as a max gain
on a call option because, you know,
technically speaking, the stock could
continue to rise. And if it continues to
rise, the call option would continue to
gain value as long as the call option
hasn't expired yet. So, you want to make
sure to not only focus on premium, focus
on whether you're comfortable owning the
stock if the trade goes against you. If
you are selling options, right? If
you're selling options, the most
important thing is you like the stock
and you don't mind getting assigned.
Now, if you're buying options, make sure
that you're comfortable spending the
money on premium because the money that
you spend, you can lose 100% of that.
Whatever you spend on the option that
you buy, it can go down completely and
you could end up losing. So, it can be
really risky and you can also lose a lot
of money if you're just buying a ton of
call options or you're buying a ton of
put options. So, if I wanted to lower
the risk, I would pay very close
attention to position sizing. Okay, so
let me show you kind of a little bit
about my portfolio. You can get some
kind of pointers here on what I've been
doing. You know, I've been scaling my
portfolio for 12 years now and I worked
at Goldman Sachs and I kind of made it
my dream and my mission to really
understand how to trade options and have
more freedom. I really hated working at
9 to5 jobs. So, this is kind of my
passion. This is what I love and I'm
very talented at teaching this as well.
So, I want to kind of show you here kind
of my thought process on position sizing
because position sizing is incredibly
important. No matter how experienced I
really am, it's not like I can predict
the future. I make mistakes as well.
Stocks go down and they can be very,
very unpredictable. So, what I like to
do is I like to just, you know, get into
positions that I like, but typically I'm
only putting in, you know, 3 to 5% per
position. For example, even if I really
love a stock, like I love, you know,
several of these stocks. I'll kind of
show you what I do with Nvidia. So, I
love Nvidia. Nvidia is a leader in AI.
So, I personally allow myself to go up
to 10% of my portfolio in Nvidia. But
you can see here I'm selling a lot of
put options because I personally love
passive income. I like selling put
options where I can generate passive
income. Then you can also see I have
plenty of covered calls. A covered call
is basically when you sell a call, it's
called a covered call because you have
the shares, you know, behind it. So you
are covered, right? So I have I ran sell
puts, I have American Airlines, I have
Shopify, I have Nvidia, Chipotle, SoFi,
Robin Hood has been doing pretty well
for me recently. And then Google I have
a pretty large position here. I'm going
pretty heavy on Google, so I'm kind of
breaking my position sizing rules, but
again, this is more of a beginner video.
When you become more advanced, sometimes
you might be okay taking on more risk on
a certain position when you have a high
conviction play. So, I have lots of
different high conviction plays that I
like to personally make. And by the way,
if you want to be part of my high
conviction plays, you can visit the link
in the description. I basically show
everything that I do within my coaching
program, everything I'm buying and
everything I'm selling. But how do you
know if a stock is not going to go down?
And that's by using some simple things
called technical analysis. Technical
analysis can make or break your trading
success. It can make you either very
profitable or it can make you a loser.
in option trading or any type of trading
really. So technical analysis is simply
just analyzing the price movement of a
stock using multiple tools that I'm
about to cover and show you real
examples of. So many great option
traders I've worked with many of them
have used technical analysis to a great
extent including myself. I use technical
analysis to accurately predict where the
stock price of a stock is going to go.
Now this isn't perfect. Nobody really
knows where a stock is going. In fact,
there's a famous book out there called
Random Walk Down Wall Street, which
discusses stocks being completely random
and not having any clear direction where
they're going. Now, that book is not
completely correct, but it's also not
completely correct to understand or to
say, I know exactly where the stock is
going to go. That's a complete lie and
almost nobody can do that. So, I'm
somewhere in between. I think that
technical analysis is very, very
helpful. Gives you a very good sense of
where a stock is trading at and where a
stock is likely to be in the future.
Now, short-term trading is very
difficult, which is why I personally
prefer monthly income strategies, but
I'm going to show you all the strategies
that I know around technical analysis,
and I've said this many times on my
channel before. My favorite three
technical analysis tools are RSI, moving
average, and Bowlinger band. The first
one that I'm going to teach you is
called moving average. All right. Now, I
want to go over the basics of Amazon
stock and the technical analysis. So, I
want to show you how to spot when a
stock is undervalued, how to draw some
trend lines, and how to analyze it on a
technical basis to decide if a stock is
cheap or not, and where you may want to
get in or what option strategy you may
want to use. So, here we have Amazon
stock, and I'm going to get rid of any
comparisons. I'm going to show you from
scratch just basically the price action,
nothing else for now. So, we can
actually see that Amazon has had a huge
rise. Now, a huge rise can happen due to
earnings or any event or any news. And
let's go to the last six months here.
You can see how the stock had a strong
bottom at right around $200 per share.
That's very common, by the way, in the
stock market that a stock can bottom out
at an exact even price. And it's because
the value of a stock is often
psychological. So here we can see there
is a double bottom, a very strong double
bottom pattern on Amazon at $200 per
share. The stock ended up bouncing twice
from this $200 level. So this would be I
would say even beyond support. This
would be pretty much the cement base.
Okay, this is the cement base. I'm going
to be drawing here multiple different
trend lines. So first of all, we're
going to draw the cement base. Now from
a longer term perspective, the stock has
gone from this level here, okay, right
around here to this new support right
here. So there's a new support at around
$227 per share. So as we can see, Amazon
stock is in a pretty good run. actually
a very strong run, but the bottom has
actually formed another pattern. It's so
interesting how a stock will form
multiple different patterns that are
actually pretty obvious to look at. So,
there was a strong double bottom here
and now we have a new double bottom.
This is our new cement base, I'll call
it 226. Okay, and we can see here that
Amazon has went from a bottom of 200 to
226. Now, it's also pretty interesting
because it had a double top pattern
here. Okay. So if I draw a line, we see
here that our resistance is 274. Okay.
So 274 roughly 274. Again, very
interesting because over the last 6
months, Amazon has been in a pretty wide
range, but again on the technical basis
when you draw the lines, you can see
that it's likely to continue to trade
within this range. Okay. So my value for
Amazon is 270 and it looks like it has
increased actually above what the
technical analysis is showing for the
last 6 months. Now I'm going to show you
some more technical analysis that is
more forward-looking potentially because
when we look at the history here for
Amazon, it's not looking too good in
terms of where the price is at right
now. So in terms of an option strategy
that I would use, I would use something
like a call spread, a call credit spread
to be specific, which we'll discuss
later on. could be potentially even
hedging on the downside or even betting
on the stock kind of retracing. Let me
show you actually another indicator that
you should be looking at. So, I'm going
to add here indicators and I want to go
to moving average. Okay, so let's add
the moving average here. And the 50-day
moving average is fine. So, for me, I
like the 50-day moving average as a
default. Other investors are also using
the 50-day. That's why it is a default
setting here on Yahoo Finance is because
the 50-day moving average is very
common. Now, the moving average tells me
two things. It tells me basically where
is a stock trading in relation to its
average of the last period, right? So,
here it's 50 days. So, the 50-day
average for Amazon is 247. Okay? So,
that's telling me that on average for
the last 50 days, Amazon is $247 per
share. And now we're sitting well above
that. So, that could also be an
indicator that we're a little bit more
expensive than the average last 50 days.
So, I'm not really getting the best deal
here. Now, you don't have to do 50-day.
I do like 50-day a lot, but you can also
play around here. You can change the
amount of time. Some people like 30-day,
they like to have a shorter return
window, and others like to even go for
something like 90 days. Okay, so if I go
for 90 days here, okay, I'm going to go
for 90. And essentially here, you'll see
that the line here is much more smooth.
Okay, it hasn't changed drastically. It
went from 247 to 250. And it just shows
you how a moving average really does
smooth out the average price because it
takes into account the different prices
that the stock closed at for the last
period here. Again, it's 90 days instead
of 50. We had 50 before, but with 90,
it's actually pretty similar. It's a
little bit more smooth, though. So, it's
it's more smooth here at 250. And again,
this tells you on average what the stock
has been trading at. So, 250 would seem
like a more reasonable price level for
Amazon's huge increase here, though.
Could be warranted, right? if they had
good earnings or they had a good event
that could be very much warranted for
them to go up and oftent times it is
those earnings that come in and surprise
investors and what causes the stock to
go up, right? But if this would happen
for no reason and was not earnings, then
then that would be kind of a fishy sign
that hey, maybe the stock is up for no
good reason and then that would be even
more compelling to be bearish on it. Now
on a long-term basis though I'm not
bearish on Amazon because when we zoom
out and we go to one year we can see
here that the stock has been trading
sideways here got crushed there was a
period of time where the stock market
entirely was not doing so super well
Amazon being part of that whole group of
stocks and now Amazon very volatile
actually surprisingly very volatile for
a MAG 7 stock when I look at the
technical analysis first of all I like
to get a bird's eye view and understand
what does the chart even look like okay
before I put any indicators before I
draw any lines before I even do moving
average. What does this visually look
like? Okay, now we are we have plotted
the moving average here. We see that the
moving average has actually been pretty
stable for the most part. Right now, I
want to add another indicator here. Let
me just clear the drawings real fast. We
no longer need the drawings. I want to
show you now the moving average, which
we just went over. I want to show you
the RSI. Okay, so let me go into
indicators here. I'm going to go for
RSI. Now the RSI is really interesting
and the RSI is actually very useful for
understanding investor behavior as well.
So RSI will basically tell you how hot a
stock is or how cold it is based off of
momentum factors. Okay, so we can see
here, let me actually get rid of Corell.
We don't need that for this video. But
you can see RSI here. It says
parenthesis 14. So when we see 14, that
means for the last 14 days. Again, I use
a default setting. You can go higher or
lower. And there's different advantages.
It's trying to show you a story. Okay, I
like the 14-day story. It gives me a
nice two-eek view. And then whenever I'm
doing my option trading, which is
typically on a monthly basis, I pretty
much can see for the next two weeks or
the past two weeks what I think the
stock can do in terms of how hot it is
in terms of overbought or oversold.
Okay, if it's around 20 or even around
30, that basically means that it's
oversold. Okay, we can see here how when
Amazon was coming all the way down to
around $200 per share that it was
essentially in the oversold territory.
It was at 24 RSI. Okay, so it's becoming
very very cheap. Okay, and then here
when it was reaching its kind of peak
here and the resistance level, we can
see that it was actually at 8180. So it
was overbought. Okay, so we can see that
RSI is very helpful telling us what the
investor sentiment and momentum is based
off of volume and purchases. So here
again at you know around 30 or below
it's oversold. So that should be very
interesting to you terms of bullish
strategies and then when it gets
expensive it should be a warning sign to
you to not get into the stock or to bet
against the stock to be bearish on the
stock. Okay. So we can see here with
this huge rise the stock essentially
went from you know neutral territory 37
which is slightly oversold to kind of in
this higher range of 70. So again, this
tells me that, you know, a big event
occurred, likely earnings, and now that
Amazon is a lot higher. It's trading for
64 on the RSI. So it's not super
expensive by no means, but it's
definitely not cheap at this level. So
if I was considering a strategy to get
into Amazon and I like the stock, which
I do long-term, I would not want to buy
it at these levels. I would instead want
to look for a better entry and that
would probably be something like selling
put options. Okay. Now to pick the
strike price and to sell a put option,
I'm going to be using the bowlinger
band. Okay, so let me add indicator here
and let me use the bowlinger band. Okay,
so now I'm going to add the default
setting again for bowlinger band, which
here will be a period of 20 days.
Standard deviation will be two. Okay,
let me zoom in here a little bit. We're
going to look at the three months here
in terms of uh looking at the stock a
little bit closer. And I want to explain
to you kind of what Ballinger band uh
looks like and the purposes of it
because I love the Bowlinger band. I
think it's incredibly descriptive. So
the Bowlinger band, you can actually
think of it pretty much like a
statistical curve. It's based off of
statistics. One standard deviation is
68% and two standard deviations is 95%.
Okay, so what this tells me is right now
we're using two standard deviations. So
we have a 95% capture essentially or
visually you can see it's capturing 95%
of what should happen to the stock based
off of volatility and statistics. You
can think about it very similar to human
height. So if you're a man, you're 5'
10, you have a son, he's going to be 5'
10, that would be a zero standard
deviation. You would assume your son
would be about the same height as you.
Now if your son instead of 5' 10 is 6'1,
maybe that's one standard deviation
away. So now you'd be, you know, in the
68th percentile. He would be on a little
bit to the higher end. Your son would be
a little bit taller than you. That would
be a little bit unusual, but not that
unusual. Now, if your son is 6'4, okay,
that might be at the two standard
deviation of likeliness, right? So not
likely. Okay, 95% of the time that would
not happen. 5% of the time it would
happen. Your son would land here where
the 5% is, hey, that happened. He ended
up being super tall compared to your
genetics, right? So that standard of
deviation, it tells you how likely an
event is to occur in relation to what's
normal and what's average. Okay, with
human height, we know that a few inches
taller is already kind of, you know, a
little bit unusual and then 6 in tall
would be very unusual and then a whole
foot taller would be very, very, very,
very unlikely. Possible, but very
unlikely. Here the same thing is
occurring. We're looking at the
bowlinger bands and essentially the
bullinger band here is 95%. So again
it'd be equivalent to your son being 6'4
if you're 5 foot 10. Okay. So it's not
usual that the stock falls outside of
the bowlinger band. Now again we had a
big event here in Amazon skyrocketed
went above but then it again fell within
the Ballinger band. However you'll also
notice that the Ballinger band expands
given volatility. So when there's more
volatility the Ballinger band is
expanding. And I just wanted to show you
guys that Amazon did report earnings on
July 30th, which was a 20%
year-over-year increase. So again, I I
already knew that approximately this
event was from earnings because many
stocks are reporting earnings right now.
It's like earning season. So Amazon
reported above average and above
expectations and that's why it went up
and the increased volatility here also
increased the size of the Bolinger band.
That's why the Ballinger band here is
increasing. But over the one year,
you'll see here that the Ballinger band
actually captures Amazon or or any
stock's performance very very close to
within its range. Okay? So sometimes it
ends up being above the Ballinger band
in terms of a huge massive, you know,
rise. But even as you can see here,
whenever the stock rises above the
Ballinger band, it kind of tells you
that, hey, this is a little bit
overbought and then it ends up coming
back down to within the Ballinger band,
right? Again, here it went above the
Ballinger band for a small period and
then again it comes crashing down. And
here this was an overreaction and we can
see here it went outside the bowlinger
band pretty significantly and again you
kind of come back up. So the bowlinger
band tells you kind of like a gravity.
Okay. So when a stock goes up too much
the bowlinger band is telling you that
likely the stock will come back down to
reality. So the stock market trades
based off of cash flow and fundamentals
more so than technicals in the long
term. In the short term it trades more
on the technicals. We're about to get
into the fundamentals and I'll help you
understand the fundamentals. But to
finish things off with the technicals
here, the technicals are incredibly
important because it can tell you in the
short term what the stock may do.
Whether that's RSI, the stock is
overbought or oversold, whether it's the
bowlinger band, and if you're falling
outside of the bowlinger band, likely
you are to mean revert. Mean revert
means come back to baseline. Kind of
like, you know, I'm 85 kilos and if I
were to diet it down a lot to let's say
79 kilos and my body would not be
comfortable there, it would revert back
to the mean, back to whatever my
baseline weight should be, right?
unhealthy weight for me or you see what
I mean by mean revert. Mean revert just
means come back to the central tendency
right so mean reverting here would be
back to you know around here we can see
that the stock went from 254 to 274 but
that was from earnings and earnings is
indeed a very interesting and different
time period. So earnings affect stocks
tremendously and on this channel I
talked about Palunteer many times and in
my community I have given Palunteer as a
as a play. ended up doing extremely well
and a lot of that was from earnings. So,
this ended up ch like literally changing
investors lives. I actually caught it a
little bit before I ended up doing at
109 right here. I ended up catching it
at a very very good time. I made a video
at 109 and I had run several strategies
which you'll you know learn about later
on. I did a leap. I did a poor man's
covered call and I bought call options
as well in my uh challenge which I run
from a quarterly basis. We ended up
killing it. really did well here and a
lot of this was well first of all
Palanteer was undervalued and then
earnings came in and now the stock's at
a whole different price. You can see
just how much of a difference it makes
to catch trends and catch opportunities
at the right time. I had plenty of
investors that ended up doing like 100K
here and now they're sitting at almost
closer to 200 especially when you factor
in the options that are leveraged,
right? Options could do um a lot more
than a stock can because it's a
leveraged tool. Okay, it's like a
double-edged sword. when the stock goes
up and you're bullish, you can end up
doing multiple times and then when the
stock is, you know, not doing too well,
you can end up losing money. So, you
have to be very careful with how you
trade options. But options can be
extremely lucrative and something like
Palanteer here, when you look at the
trend and you catch the technical
analysis correctly, the bowlinger band,
all the stuff that I just taught you,
you could do extremely well. All right,
so now I'm going to teach you some
metrics that you need to pay attention
to when looking at what option contracts
to buy or sell. All of these things that
I'm about to teach you are going to be
extremely useful when you're analyzing
how safe an option is. The first thing
that I want to talk about is called
implied volatility. Implied volatility
is usually expressed as an annual
percentage. And what percentage reflects
the magnitude of how much a stock is
expected to change in either direction
for that given year up or down. And
people get confused over this term
because it can look confusing, but it's
actually very simple. We know that
volatility means how much a stock price
moves up and down. If it moves up and
down a lot, that means that it has high
implied volatility. If it doesn't move a
lot, then it has low implied volatility.
So ask yourself, do you think Coke has
high or low implied volatility? Well,
the answer is Coca-Cola has low
volatility. If you look at something
like a GameStop or AMC when things were
going crazy and parabolic during those
times, those were high volatility
stocks. Implied volatility just refers
to how volatile we expect a specific
stock to be. And to measure that, every
stock is assigned an implied volatility
percentage. This can get really over
complicated. And all you really need to
know is that anything above 50 is a high
implied volatility generally speaking.
And anything close to 100 is extremely
high implied volatility. Meaning the
stock is expected to shoot up or down a
lot. Typically stocks with extremely
high volatility. These may be
biotechnology companies that have some
big events coming. This may be really
hype meme stocks that have some news
coming. This might be stocks that have
had a short squeeze of some sort. So,
for example, if you remember what
happened to GameStop back in 2021, it
had a really high implied volatility
right before the stock skyrocketed and
then it plummeted back down. So, how
does this apply to option trading? Well,
stocks with higher implied volatility
are going to have higher premium. So
even if there are two different stocks
at the same exact price, the premiums on
them could be very very different. And
if one is expected to be more volatile,
the premium on the more volatile stock
will have more premium. Implied
volatility is also very interesting
because when you're screening for stocks
and you're looking for good stocks to
buy, so for example, I do use a software
called OptionsFi. When I'm using a
software like OptionsFi, they're
screening for high implied volatility
stocks. The reason why I like high
implied volatility stocks is because I'm
typically an option seller. So when I'm
looking to sell options, I do want
higher premiums. If I'm looking to buy
options, then I want lower premiums. The
next thing I want to talk about is the
Greeks. So the Greeks are very
important. It sounds a little bit
confusing, but the Greeks basically
explain how an option behaves. Okay, so
if you have no strategy when going into
an option trade or you do very little
analysis and and wonder to yourself,
well, how would I lose money here? What
if the stock goes up by $1? How much
will the option change? The Greeks
actually explain this. So the Greeks in
option trading consists of really five
of them. You don't need to know all
five. I'm going to go over them very
briefly, but the first one is the most
important one, which is delta. Okay, so
delta actually explains a couple things.
Okay, first of all, if you look at
delta, it explains the chances the
option will be in the money. So, if you
look at an at the money option, let's
say a stock is at 100, you look at a
$100 covered call or a $100 put, it's
going to be 50 delta because there's a
50-50 chance that the stock is going to
be about the same price as it is right
now. If you go for an out-of-the-oney
option, okay, it's always going to have
lower delta cuz it's lower chance than
50%. It's going to have a lower delta.
We use the five Greeks basically to help
measure and predict the price movement
of an option premium. Now, as I screen
record my phone really quickly, you can
see on Robin Hood that we're going to
look at some of these Greeks and we're
going to go over them and uh what they
mean and how to actually use them. All
right, let's go into Microsoft. I want
to show you what selling a put looks
like, why I want to do it right now, the
Greeks around it, and everything else in
between. So, Microsoft has had earnings
which also performed extremely well,
just like many stocks are performing
well this earning season. And Microsoft
is up a very good amount. And I think
Microsoft will probably cross $500 per
share. This is another stock which I
told my community about that I think
Microsoft's at 500. People thought I was
crazy right here when I was saying it's
a $500 stock. I think that can happen
within 6 months. And all of a sudden,
you see how one big event can literally
change everything, changes the whole
valuation of a company, right? So a lot
of people are doing bad right now
because AI stocks are super volatile.
Yet some of the more boring names, some
of the more traditional MAG7 stocks,
absolutely game changers. Just
completely life-changing money and
generational opportunity here. When a
stock goes up this much by $100, that's
just, I mean, speaks for itself. Now,
let's say the stock already went up and
now you're considering to get in, right?
though. Let's look at selling a put
option because selling a put option
almost all the time, especially if
you're looking to hold the stock on a
long-term basis, it would be more
advantageous to sell a put option
because when you sell a put option, you
know, you straight up get a better
price. I mean, what would you rather do?
Buy Microsoft at $4.99 or basically look
at it from a sell put perspective and
sell a put option and potentially buy
the stock for lower or potentially just
get paid not to buy the stock, right?
So, let's open up a put option here. I'm
going to expand the 480. I just want you
to understand what these Greeks mean.
Okay? So, when I look at selling a put,
I pick September 18, which is roughly 30
days out from right now. And I like
monthly options. Now, when I look at the
Greeks and how I want to understand the
Greeks really, you're looking at the
delta, gamma, theta, vega, and row.
Okay. Now, vega, it stands for
volatility. So, one thing that's
interesting is a stock could stay the
same yet the options price could
increase. Okay? So if you're you know
say you bought a call option here
Microsoft could stand still the stock
could do nothing yet the option can
become a lot more valuable and the
reason it can become valuable is because
of volatility. So if volatility
increases in the market then for each
one point increase in volatility this
option would gain 57 right which is a
pretty significant move considering if
volatility increased by 5% or or so then
this option would have $2.50 50 cents
more in value. And given it's only worth
$10, then going from 10 to 12 a.5 is a
very huge change. It's a very huge
change in price from really nothing even
happening besides expected volatility
going up. So volatility is a really huge
factor. And oftent times when I'm
trading live, I'm looking at historical
volatility and implied volatility
whenever I'm making decisions. So when I
do my live trading in my community, I am
looking at, hey, where's the stock? How
has it been trading for the past, you
know, 90 days? is what does the history
look like and then what is the
expectations going forward and when
there is a discrepancy there then I'm
interested in in taking advantage of
that discrepancy and essentially
arbitrageing that opportunity now vega
here is important but really what you
should focus on as an investor don't
focus on row because row here is just
interest rates the interest rates don't
change much theta is important if you're
an option seller if you sell a put
option theta is how much this option
decays in value on an everyday basis so
this option actually It's decaying
fairly fast. 02 theta is essentially
think about as you know each option is
100 shares. So this is 20 bucks. So $20
is the amount that this option is losing
per day. And actually if you sold this
put option $20 is the amount that you're
gaining per day in this example. So $20
in theta* deck is actually your expected
value daily from having sold this put
option. So if you decide not to hold
until expiration on average, all things
being equal, if the stock stays the
same, volatility does not increase,
interest rates don't change, which they
rarely do, then every single day this
option, you would gain $20 as the person
that had sold it. Okay? So in a week,
you know, would be $140 and anytime you
won, you can cut and take profit here.
Okay? But the most important is really
delta. Delta tells you everything you
really need, especially if you're a
beginner. You don't have to be an expert
at any other stuff like gamma. Gamma
measures how much delta changes. But
again, if you look at delta, it tells
you pretty much the entire story. Okay?
So, if I sell a put option on Microsoft
at 480, 30 delta is telling me that
there's a 30% chance that Microsoft will
be at 480 or below. Now, 30% chance I
mean that means overwhelmingly 70%
chance that it does not go there. So
that means seven out of 10 times when
you sell this option really nothing
happens. So you just end up selling it
not getting assigned and $9.90 here the
premium is just yours to keep. Right? So
whenever you sell the option you collect
that premium there's no more obligation
at expiration. You're good to go and you
can do this all over again. Okay. The
delta here is very very important. We'll
talk much more about that as we go on
with this course. So delta is the most
important one. Delta measures how much
the premium price of an option will
change for every dollar the underlying
stock price moves. So for a call option
this can be anywhere from 0 to one and
for a put option this can be anywhere
from 0 to negative 1. Again not a big
deal. Basically think about it as if it
moves up by a dollar then your option
will move up by 50 cents towards the
direction of the option. So if an option
cost $3 and has a delta of 0.5 well if
the stock moves up by $1, then this
option will increase by 50. So it'll be
from $3 to now $3.50. If it moves up by
another dollar, then this will again
move up by 50. Now, like I said, theta
is really interesting because when
you're an option seller, you can
actually take your theta and see how
much money you're making per day. So
let's say that your theta is 10. Well,
then you're making $10 per day on that
option contract being open. So if you
have many option contracts, you have 10
contracts and then your theta is 10,
then you can make $100 per day
consistently just through theta as long
as the stock doesn't have any crazy
moves. And that's exactly how I trade
options is I have a bunch of positions
open. I have maybe 20 positions. Each of
them might, you know, have a theta of 30
to 50 and voila, making well into the
five figures or the multiple five
figures per month in option premium.
When options are closer to the money,
they tend to have much more higher rates
of theta decay because they're right at
the edge of either being valuable or
being completely worthless depending on
the stock's price, the strike price. So,
you know, when options are close to the
money, the theta is going to be higher,
which is kind of fun and kind of cool,
but also more dangerous because the
delta will be higher. And when the delta
is higher, that means there's a higher
chance of you getting assigned. Whether
it's selling a put option, it's closer
to the money or a covered call. It also
is closer to the money. All right, let's
go over fundamental analysis. This is
super important. I rarely do this on
YouTube. It can be a little bit
technical, but bear with me. I'm going
to try to be as simple as possible to
help you understand what I look for when
I do any fundamental analysis. I'm going
to go to the statistics tab here on
Yahoo Finance. And this will tell me
pretty much all the financial numbers
that I need to look at. Right off the
bat, I'll tell you one thing. Whenever
I'm trading options, I don't like
companies under $2 billion. Amazon is
obviously huge, huge company, massive
market cap. It's in the trillions. Um, I
do trade stocks that have, you know, a
little bit smaller market cap for sure.
A h 100red billion is fine. 10 billion
is fine. But when you go too low, like a
company that's $2 billion and lower,
then typically it's it's very very bad
to trade that stock. I'll go overly.
This is a stock that I used to trade a
lot back in the day. I haven't touched
this stock for a very long time, but
I'll show you why it's not good to look
at a company that has a very small
market cap. You can see here that the
market cap is just $429 million. Okay,
so let me go to trade onlyly options and
I'll show you, you know, why this is bad
and dangerous and doesn't really work on
a risk basis or even liquidity basis or
really anything. So if I go to September
here, okay, and let me expand the 13
here, you can see that the bid is 60
cents and the ask is $1.15. Super super
wide. And this gap right here represents
that there's no liquidity. Okay,
nobody's really trading this. The volume
is zero. No one traded this. Open
interest is 80. Very very low. the
implied volatility is very high, but uh
if you're looking to trade something
that's very small cap like Oley for
example, not really my favorite because
um when the market cap is so small,
there's very low volume. Okay, it's
typically not very popular as a stock. I
would not do any spreads on this,
especially because a spread is two
option legs. I really wouldn't do any
options on a small cap stock like this.
So instead, I'd be looking for a company
that at least has uh over $2 billion
market cap. And a lot of my steady gains
right now having a pretty, you know, low
month. I would say $ 1.7 uh% for me.
70K, it's a lot, but this is a lower
month for me. Ended up having one losing
trade. And I'll be honest, sometimes I
have losing trades. I'm never perfect.
And sometimes I make even some silly
mistakes myself. But overall when I look
at technical analysis and fundamental
analysis and I put it together tends to
do really well and it helps me when I
focus on real statistics real valuation
and not hype and sometimes I see stocks
that I'm very excited about. One stock
I'm kind of interested right now COVID
I've been looking into it some of the
more volatile names but really at the
end of the day when you look at
something like an Amazon and you analyze
it properly you understand the value of
the company you could do extremely well
with options. So, let me show you kind
of what I look for when it comes to
fundamentals. Market cap we just talked
about. Really, the next thing is PE.
Okay, there's two different pees.
There's a trailing PE and a forward PE.
Okay, so a trailing PE is basically, you
know, what is the price to earnings
ratio right now on the last 12 months,
right? So, it it takes into account the
price and then divides it by earnings.
Okay, think about it like real estate.
If your property costs $100,000 and you
make $10,000 a year in rent, that's a 10
PE. The price of $100,000 divided
by$10,000 of earnings is 10 PE, right?
If that property was more expensive, if
it was $200,000, but you still cash flow
the same of $10,000, that would be a 20
PE. So, you can see how a higher PE
ratio is worse because a higher PE ratio
means that you're paying more for the
earnings that you're getting. Okay? So
the higher PE, the worse it is. Okay.
Now, forward PE typically goes down. For
Amazon here, it's actually going up,
which could be a glitch here on on Yahoo
Finance, but most likely what it is is
that earnings expectations for next year
are actually slightly lower for Amazon.
Okay, now that's pretty rare. I
typically don't see that. And we'll do
another quick example after Amazon, but
this Ford PE ratio should be going down.
You ideally want it going down. Okay.
And we can switch to balance here in
just a moment, but I'll go through some
more what this means. Okay, the PEG
ratio is essentially price to earnings
divided by growth. Okay, it factors in
growth. And this number 1.46 is actually
pretty good and it's it's been coming
down. That means the price that you're
paying for the growth that you're
experiencing is very good. It's very
balanced here. The lower it is, the
better. Now, price to sales is very low
for Amazon. It is incredibly low. And
the reason why it is so low is because
Amazon has a lot of sales. They're not
necessarily profiting a lot from their
sales, although their profit margin
increased. We can see here their
operating margin is 13.69%.
Which is actually excellent given that
Amazon historically was much lower. It
was 4%, 3%, and that's because all they
were doing was e-commerce. And now
Amazon is making a lot of money from AWS
cloud and other more softwarelike
revenue. and it has improved their uh
operating margins significantly now that
they're not focusing as much. They still
are, of course, but they're not only
making money from just e-commerce. They
have many profit engines within their
business. So, you want to see margin
going up and a healthy margin depends on
the industry. Okay? So, for a retailer
like Costco, for Walmart, for Amazon, it
can be very low. And then when we look
at something like a uh let's go to
something like a data dog, okay? Or any
any software company. Let me go to
another software company. Of course,
Nvidia would be the easiest one of all.
If I showed you Nvidia, it's going to be
the highest profit margin. So yeah,
let's go to Nvidia. This one I know 100%
I know that it has the highest profit
margin of anything out there. 65%.
Absolutely insane. Nvidia has like the
best business ever. That's why it's the
most valuable company. Not only are they
making crazy money, but it's not like
e-commerce like Amazon. And it it's
crazy money on high margin, high profit
margin, 65% here. So we can see just how
crazy that is in terms of helping them
have such a big valuation in market cap.
The PE ratio here is more normal than
Amazon. It's going down. Okay. So this
is an expectation that Nvidia's earnings
will be increasing. So as they increase
in the forward PE ratio saying in the
next 12 months, not in the past, in the
next 12 months, what are we expecting
here? And 25 means that you are getting
a better price. So it'll be cheaper in
the future because they will have more
earnings. The PEG ratio is amazing here.
It's you can make an argument that
Nvidia is so much better than Amazon
based on the valuation here. The PEG
ratio under one. Great. You can see here
how the valuation is great in terms of
PEG ratio. The PE ratio in general
trailing and forward is just a little
bit more than Amazon. Not by much. But
look at that price to sales is 21. Okay.
So very very different from Amazon. And
that's because they have such a huge
profit margin that they are valued many
times more than their sales. They
deserve that because they are profiting
so much from it. Okay. Now this is the
revenue. You can see the income
statement. I look at revenue because
that's that's life of the business is
how much are they bringing in in terms
of revenue. That's a very important
figure. Now of course revenue alone is
not the only number because there's a
difference between how much you make and
how much you spend. Okay? It's similar
to any of us, right? So it doesn't
always matter how much money you make.
It depends how much you spend. I've
worked with a lot of doctors as clients.
And doctors sometimes can make good
salaries, $30,000 a month, $35,000 a
month. But after their taxes, after all
the, you know, money that they pay to
the government and they're left with,
say, you know, $18,000, then they have
an expensive wife that spends all their
money or they have lots of liabilities
like cars and um other expensive things
and at the end of the month, they're not
really left with that much money. It's
because they're living above their
means. Okay? You know, that's one case
versus someone who's making $10,000 a
month, but they're living super
frugally. They're living a very frugal
lifestyle and they save, let's say, you
know, half of that. They say 5,000. So,
someone making 10,000 could end up
having more earnings or net earnings
than a doctor making triple their
amount. So, that is what we call uh net
income. Here we see net income and that
all comes down to EPS. So, EPS is one of
the most important figures as well
because that's the net earnings to
shareholders. Okay, so you know we care
about that, right? And we can see here
how quarterly earnings growth can grow
significantly. So for Nvidia, it's grown
200%. So going back to the PE ratio,
when you see a high PE ratio, it doesn't
really matter that much because
Palanteer had a PE ratio of over 100 and
people still think that it's an
expensive stock when it was at $109 per
share. I ended up buying it and I made
over $70,000 on Palunteer and you know
in the last 30 days personally and you
know I can't imagine how much my
community has made in total you know
probably like millions and millions of
dollars because you know I have a couple
hundred people that come onto my
coaching session and they all get to see
what I do. So when we have 200 people
they're executing on balance here that's
probably many tens of millions
potentially. Obviously I don't have that
statistic but the key here is that
earnings can grow very fast and when
earnings grows P ratio can fall down
very fast. P ratio is just one important
metric but when I'm valuing a company
when I'm doing my valuation model before
I trade it before I tell my community
about it I'm trying to understand the
full story. I want to understand the
earnings growth. I want to understand
their cash flow and I also want to
understand kind of what their balance
sheet looks like. So a balance sheet is
pretty much like a snapshot. Okay? So
think about it like you know I told you
about a doctor making 30K or another
person making 10K. Well that's their
earnings. A balance sheet is what they
have on their bank accounts right? So
they have total cash of $53 billion.
They have debt of 12 billion. That's
great. So that is a really good ratio.
Yeah it's a very nice ratio because they
have a lot more cash and they can cover
their debt. So there's should be any
tough times. They should be able to
weather that storm if they need to.
Right now I also do look at short
interest. If it's high then avoid that
stock. You don't want to be in a stock
that has high short interest. It just
really doesn't make sense. You wouldn't
want to be in that. And you can see here
a lot of other metrics here. Not as
important, but definitely still tells
you the overall health of the company.
All right. So, now we're going to be
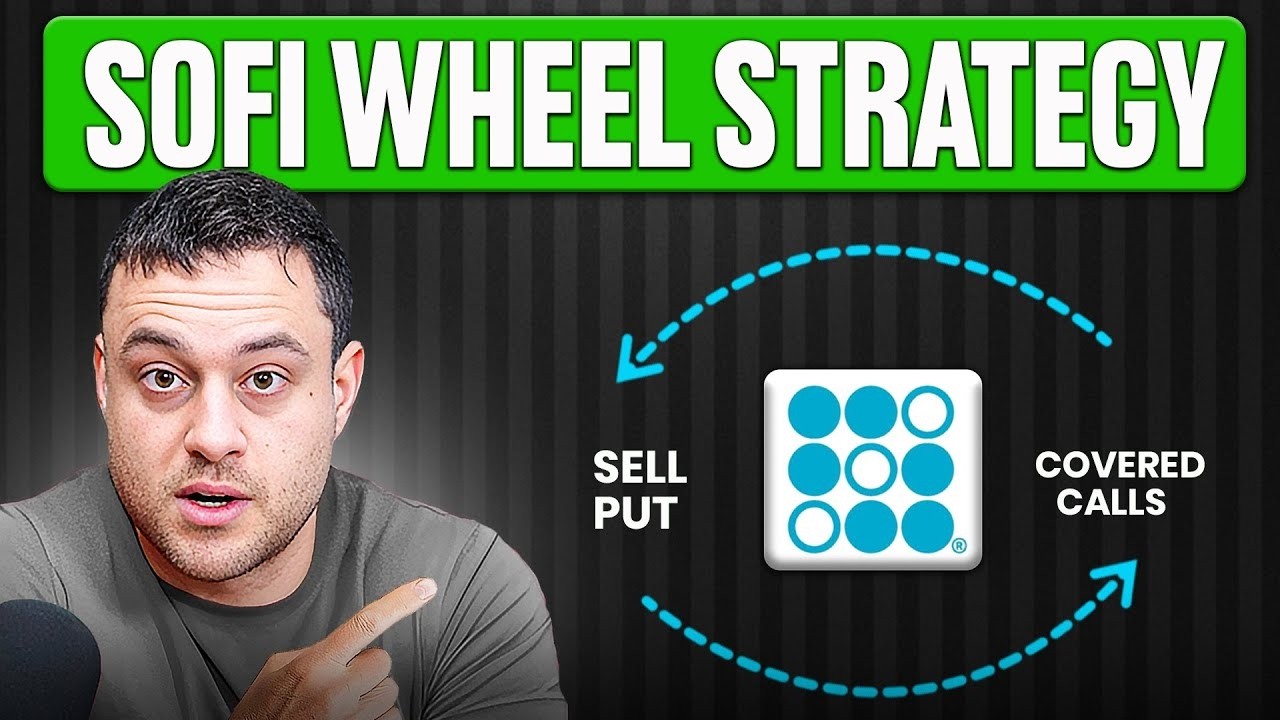
talking about the wheel strategy. So, to
do the wheel strategy, you need to know
what a covered call is. You need to know
what a cash secured put is, which I
covered earlier in this course. So, go
back to that if you don't fully
understand them. The will strategy
involves a covered call and a cash
secured put at different times. To start
off the will strategy, all you want to
do is sell a put option. Once you get
assigned, you start selling covered
calls to generate income on the position
that you got assigned. The will strategy
is my very favorite strategy, especially
as you scale your portfolio. So, first
you start by selling a cash secured put.
A cash secured put means that you have
the cash that if that put were to get
assigned, then you have the cash to
purchase that put option if you do get
assigned. So, say that you sell a put
option at the $100 strike of a, you
know, different stock. Let's say it's
Apple. Then, if you get assigned at
$100, that's basically a $10,000
position. You can also sell a, you know,
put option on something cheap like
American Airlines, that would be $1,400
if the strike is 14. So, a covered call
means that you already have the cash set
aside in the account as well. So,
whether it's selling a put option, you
do need to have the cash set aside or a
covered call option, you need to have
100 shares of stock. So, again, this is
a capital intensive strategy. So you
will want to have a stock 100 shares of.
So like that could be Palenter, that
could be anything that you can afford
100 shares of. Or vice versa. If you're
just going to sell a put option to get
into the strategy, then again, you need
to have that cash laying around. If
those are too expensive for you, you do
have to look for the cheaper strategies
that I will cover later on in this
course. The point of the wheel strategy
is that you're never afraid to get
assigned. You are never ever afraid to
get assigned. So if you sell a put
option, you're perfectly happy to get a
signed 100 shares. If you, you know, get
assigned and you have those shares, you
sell a covered call. If the covered call
gets assigned, you lose your shares.
You're also perfectly happy. You're just
generating income on both sides. You're
generating income from puts. You're also
generating income from selling covered
calls. So, you should never be
frustrated or upset. If you sold a put
option, you get assigned. Yes, it can go
very into the money, and that can be
difficult to run the wheel strategy.
But, in like basically 90% of cases,
it'll be very easy to run the wheel. So,
I wouldn't really worry about it,
especially if you're using highquality
companies. Once you've chosen the stock
that you like, now you have to pick a
put contract with a relatively safe
strike price with an expiration date of
30 to 40 days. You can use shorter term
expirations. You can also use longerterm
expirations. I prefer to go for monthly
income. So I will pick an expiration
date that's 30 days out. And also my
sweet spot delta will be about 30 as
well. So after working for Goldman
Sachs, looking at lots of research
reports, what I realized was that
selling put options to run the wheel
strategy is specifically very good in
volatile markets because when volatility
is high, selling options is better. When
the market goes down, you make more
money than an average stock investor
does using the wheel strategy because
selling puts to get into a stock already
gives you that margin of safety as well
as cushion because when you're selling a
30 delta put option or let's say you can
also sell 25 delta, anywhere between 20
and 30 delta is a really good sweet
spot. you'll actually get assigned about
three out of 10 times on a 30 delta. If
you're doing a 20 delta, you'll get
assigned about two out of 10 times.
Obviously, the less out of the money
your strike price is, the higher premium
you're going to collect. But in general,
and especially for beginners, the wheel
strategy is not about getting greedy.
It's about safe, consistent returns. So,
you generally want to pick a strike
price kind of far out of the money. You
can also go under 20 delta. You will get
paid a lot less. If you have a bigger
portfolio, this will favor you. Now, if
you have a smaller portfolio, you may
even decide to go a little bit higher
than 30 delta because you get paid more.
The most important thing isn't how many
dollars it is out of the money, but how
likely it is to go into the money. So,
again, you can go $1 out of the money.
That could be really good for a cheap
stock like American Airlines. That could
also be not that far out of the money
for a more expensive stock like Tesla.
So, it's not necessarily how many
dollars you got out of the money, it's
how far away you go as a percentage
basis. The risk in option trading is
that in the short term you may get
unlucky. But in the long term, if you're
using the strategies that I'm teaching,
you are going to be very successful over
a longer period of time, just like in a
casino. If you were to go to a casino
and you were to make one big bet, it's
actually very scary for the casino
because the casino could lose in the
short term. However, if you go to the
casino and you just keep doing $10 bets
over a thousand times, you are virtually
guaranteed to lose because the casino
has a small edge. So, what I'm teaching
mostly on my channel is actually option
selling because option selling makes you
the casino. You become in the power seat
where you're making consistent income
using the strategies and the techniques
that I'm teaching you because I know
that they work. So, when you sell a put
option, that option is going to decay
every single day. You can buy it back at
any point because there is theta decay.
That option is becoming less valuable.
And because it's becoming less valuable,
that's a really good thing for you
because you're able to buy back that
position for a gain. As long as all
things stay even, that data will be
kicking in. Of course, if that stock
goes down, then your put option may be
at a slight loss, which again is fine.
If you take assignment, you have 100
shares now, and you're in the perfect
seat to do covered calls. Okay, to
explain the expiration date, 30 to 40
days is a pretty normal expiration.
Anything much longer than that, and
we're starting to get into the risky
territory because so much can happen
past 40 days. The thing is, you can sell
puts that are beyond 40 days. This
really depends because if you're picking
a high quality stock, you really don't
mind. So you can do longerterm options
and you will actually get compensated
more. So when you go out that 60 days,
90 days or you know multiple months, the
compensation to you comes faster because
you have to take all that upfront risk
right away. However, I will say that the
most profitable trading is between 1 to
6 weeks. That's because that's when
theta really kicks in. You can see a
chart right now on the screen. theta
really speeds up towards expiration. So,
as expiration approaches, the theta is
becoming more and more. This means that
the option is decaying in value. Again,
if you're an option seller, which is
what the wheel strategy is about, and
this actually benefits you if you're an
option buyer, this is why buying options
is better to go out longer term because
there's a lot more that can happen.
However, I will say that one of my
strategies is to buy shorter term calls,
but that's a more advanced lesson than
this course. anything shorter than 30 or
40 days. And the premium isn't going to
be that good. However, the expiration is
so short. So, you can do that many, many
times. You're going to want to
experiment with this. Again, for me,
it's 1 to 6 weeks, and there's much more
that goes into it. I also like to really
understand the stocks that I'm paying
attention to, and my list of stocks is
only about 25 or 30 stocks. That way, I
can make really good decisions and keep
trading the same stocks over and over
again. So once you find a strike price
with a delta around that range and that
expiration date, it's time to sell the
put option. This is of course the most
fun part where you get to collect your
premium upfront and then as soon as you
collect the payment, you should be
watching your position to see if the
stock price starts getting close to your
strike price. In most cases, it's really
not going to do anything. When you sell
an out-of-the-oney put, most stocks just
typically go sideways because most days
stocks are not really moving that much.
Sure, they might move half a percent,
1%, but if you're selling a three or
four or 5% out of the money put option,
in most cases, you actually don't really
need to do much. You can monitor the
trade every few days, but you do not
have to look at it all the time. In
fact, I have so many students that are
doctors, dentists, lawyers, software
engineers, they're very busy
professionals. They're already making a
high income. So, even when they do make
$10,000 per month doing option trading,
they still have a very busy life. So,
they don't necessarily want to look at
their portfolio. And I always tell them,
that's completely fine. You're not going
to get better results by being obsessive
over your portfolio. The fact of the
matter is actually really good to set a
position and just completely forget
about it. You can check on it every
couple of times per week. It's also not
really worth rolling this type of
position because since your goal is to
get assigned, I typically would not roll
a short put position or a sell put
position because I'm happy to own it.
Unless I for some reason change my mind
about the stock or I slightly want to
have a different entry point, then I can
roll it using the dog strategy. But in
most cases, this is not necessary at all
because once you get assigned, you can
do covered calls. And by the way, I
would also do covered calls around a 20
to 30 delta. I have just found that that
is the sweet spot for me. So after that,
if the option goes into the money again
on the covered call, you do have a
decision here. You don't have to lose
your shares because oftent times you'll
be generating a lot of money with the
wheel strategy. And if you're up a lot
on the stock, then you might not want to
get rid of it. You may say to yourself,
"Hey, I want to hang on to this." That's
where rolling comes in. You can roll the
in the money covered call. You can roll
it up. You might not roll it up to
become out of the money, but you can
roll an in the money option up up until
it becomes out of the money. You can do
that on a weekly basis. You can do that
on a monthly basis, or you know, you can
even go farther than that. The whole
goal is that you're going to be stepping
up and rolling up if you don't want to
lose a stock. If you're okay losing the
stock, that's perfectly fine as well.
Some really successful option traders
that I know literally only use the
strategy. They want to have a very
boring strategy for whatever reason,
whether they're retired, whether they've
already have a big portfolio and they're
just doing this to generate extra
income, they're very lazy with it. And
that's perfectly fine. I'm also a lazy
trader myself. I don't like to trade too
often because overtrading is a very big
issue. So, if I had to pick one strategy
to recommend to people who are looking
to retire safely, I'd always recommend
the wheel strategy because it's so good
and it has such big results. The last
thing I should mention about the wheel
strategy is that when you're about to
sell your covered calls, you need to
take into account your cost basis. And
to explain what cost basis is, I'm going
to show you an example. Let's say that
you sold a 165 put option for one week
and you added, you know, 30 cents in
premium. So now your break even is
164.70. That's because when you have a
put option that's at 165, you collect 30
cents, now you have 16470. So when you
get assigned, you can count your cost
basis minus the premium that you
collected. And in theory, as you keep
running the wheel strategy, you can
basically get your average cost down to
zero. Why? Well, let's just take this
example. Let's say we go back to the 165
put. So you sell 165 put, you get paid a
dollar, nothing happens. You don't get
assigned. Next week, you get paid again
a dollar. You do the same 165 put.
Nothing happens. The stock goes down,
but it doesn't reach 165. And so on and
so forth. So, let's say the following
week is more volatile, you get paid $2.
The following week, you get paid another
$1. Okay? Now, if you were to get
assigned, you've already made $5. You
made one, one, and two, and then another
one. So, now you've gotten paid $5. And
let's say you do get assigned at 165.
Well, in theory, your cost base is not
165, it's 160. So, once you get
assigned, let's say that you sell a
covered call, and you sell a covered
call for $5. You don't get assigned.
Let's say the stock just goes sideways.
You sell another covered call, you get
paid $3. So that can keep happening and
your average cost can keep going down
every single time you collect premium.
So in theory, you can actually have a
position that you pay nothing for
because you've collected so much premium
over time to basically compensate your
average cost to become zero. That means
that you know basically you're in a
really good position and you can do
anything that you want with that stock.
That also means that when you get to the
second part of the wheel strategy where
you have to sell covered calls, you want
to pick a strike price that is above
your cost basis. So if your cost basis
is 160, then you probably want to do a
covered call that is above 160.
Otherwise, you'd be selling your stock
for less than your cost basis, which is
not going to feel really good. The
covered call is best used on really high
quality companies. So, for me, that's
Apple, that's Google, that's Microsoft,
that's other highquality companies that
are in the S&P 500. I typically like to
go for blue chip stocks that have a good
reputation, good brand. That way, they
are very predictable. And on a
predictable stock, running the wheel
strategy is fantastic because you're
collecting income on the puts, you're
collecting income on the covered calls,
and the stock is typically bouncing up
and down. There is some volatility, but
not a huge amount of volatility. And
that's what makes the strategy so good
for retirement. In fact, I would say
that once you have an account that's,
you know, 50K, $100,000, then you can
basically run a majority of your
portfolio just using this strategy.
Now, we talked about advanced single-
leg strategies. One of the most powerful
tools that you can add to your option
trading arsenal is now going to be LEAPS
or long-term equity anticipated
securities. Now, don't get intimidated
by this name. In option trading, we like
to give, you know, some strategies, some
fancy names, make it sound complicated
or even, you know, like a naked call
option. We call it naked. It's kind of
like a option traders seem to just like
to make, you know, fun and have a good
time. But don't worry, I'll make
everything super simple, step by step to
understand. And this stuff is actually
not that complicated. So, in reality, a
leap option is literally just a call
option, but it's a long-term expiration
date, typically a year or more away by
definition. They're a fantastic way to
take advantage of directional moves in a
stock without having to invest the full
amount to buy shares outright. Let me
break down exactly how LEAPS work and
why they're so useful. Let's say that
you're bullish on Tesla, which is
trading for $320 per share. You believe
that Tesla's stock price will rise
significantly over the next year. But if
you buy 100 shares of Tesla stock, it
would cost you $32,000, which is a lot
of money to put in one stock. I mean,
you could just buy a Tesla with that
same money. Instead, you could buy a
LEAP option, which gives you the
leverage, the same opportunity as
basically owning 100 shares. And when I
say leverage, I mean that you can use a
lot less money to get virtually the same
result and a lot more actually for a
much lower price. So, here's how it
works. All right, I want to show you
LEAP option on Meta. LEAPS allow you to
control a large amount of stock for
essentially a fraction of the cost. Way
more capital efficient. So, as I go
through this example, you will see that
I'm able to control a lot of Meta. And
Meta is a pretty expensive stock. So, if
you have to buy 100 shares, it's going
to cost $59,000,
right? But if I buy a LEAP option, then
it is a lot more attractive because the
capital I have to spend is a lot less.
So, I'm going to go to trade options
here. I'm going to show you kind of from
scratch how I open up a LEAP option. A
leap call option is simply a call option
that has a much longer expiration date.
So right now as I select a different
expiration date, I'm just doing a call
option, but I'm giving this call option
a lot of time. Okay? By giving a call
option a lot of time, you have a pretty
big advantage because doesn't expire in
the short term. So when an option
expires short-term, well, you got to be
very lucky with the stock. But when you
have a long-term call option, the stock
can go through a little bit of tough
times. You can still end up doing very
well because you have so much time for
your thesis, your opinion, your research
to play out. The most important thing
when doing a LEAP option is really
choosing a quality stock that you're
bullish on terms of a long-term. Okay?
You want to have a company that has good
long-term momentum. Now, I'll go to the
chart here of Meta and I want to show
you a lot of the stuff that we already
learned about in this course. I want to
show you kind of what the stock looks
like. So, let's go here. Yeah, one year
is fine. Okay. I'm going to change the
moving average. I don't like moving
average of 90 days. I want to use a more
50-day moving average. So, here we go.
50 days. Okay. and the bowlinger band is
fine as well. So you can see here how
the stock is actually trending down.
Meta has been going through a little bit
of tough times. Some of the investments
that the company has made has not gone
super well and the stock has been
trending down over the one year.
However, my belief is based off of my
research is that Meta can do extremely
well due to advertising and advertising
is a growing business that they are
becoming more efficient at. So I think
that Meta is a $700 stock which it was
trading out in 2026. It was well over
700. So, I think that we're going to be
able to see the stock go to $700 in the
next 12 months and I don't even have to
be perfect timing on that because this
LEAP call option is out until September
17. So, it's really nice that I have
such a long time horizon, which gives my
investment time to play out. So, with a
one-year LEAP option, you could
potentially capture several earnings
reports. You don't need your thesis to
work immediately when you have four or
even more quarters ahead of you. So
leaps generally my experience is that
it's very nice because every single day
there's not that much time decay. So if
I go for an in the money call option
right now which is what I typically do I
like to go in the money around 70 delta.
This is at 68 delta which is close
enough. And every time the stock moves
up by a dollar well this leap option is
going to you know move by about 68 which
is great. It's very sensitive to a $1
move. If delta is 0.7 then the option
will move by.7 cents for every dollar
move in the stock. So the leverage does
work both ways by the way which makes
risk management extremely important with
the strategy. Direction matters a lot
with LEAPS and LEAP call options perform
best when you are correct on the stock's
long-term direction. This is a bullish
strategy at the end of the day. So don't
put your entire money into LEAP options.
It can be very dangerous when the stock
market pulls down. You obviously want to
have at most I would say 10% of all your
money in LEAP options and even within
that you still want to diversify.
Diversifying LEAPS across several
quality companies could reduce
concentration risk overall and LEAPS can
be used for more than just speculation.
I honestly use LEAPS all the time for
just stock replacement and being able to
buy a stock for a lot cheaper than
whatever is trading at in the market.
For me, you know, why would I buy Meta
at $59,000? That's a whole lot of money.
That's a whole lot of capital. If I
wanted to own 100 shares, that's the
price tag that I'm looking for. And the
LEAP option itself is ultimately a lot
more efficient and better in my opinion
because it replaces ownership of stock
and gives you even more kind of rewards
and benefits on the upside, of course,
on the downside. Let's just go through
this example. So, I'll go to buy call,
right? And this 550. You'll see right
here right off the bat, instead of
having to pay $59,000, I only have to
pay $14,000. Okay? So, that's that's
what I'm putting up. can't lose more
than that. And to be honest, it's kind
of hard to lose this money completely
because if you manage correctly, it can
be hard to lose the full amount. You can
lose money, but typically I haven't had
the experience of losing everything
because I'll close out the position
before expiration. I'm not holding the
option until expiration. And as long as
you don't do that, then you are in much
more advantageous situation. So, for
example, okay, we need to understand
where this option is at right now. Okay,
if you buy a 550 call option on METAM,
then right now it's at 593. So right off
the bat, you're $43 in the money. Okay,
you're $43 above the strike price. So
being above the strike price means that
intrinsically you have a value of $43.
Okay, so this option has $43 worth of
intrinsic value and the rest of the
money, which is like $95 or so is
exttrinsic value. It means that the
value of the option is really from these
Greeks which is time volatility and
mainly time and volatility. Okay, what
could potentially happen? So check this
out. If I wait for Meta to go towards
$700 per share, then here's what
happens. Essentially, if 3 months passes
and Meta increases by $50, okay, the
stock's not at 700, but increases by
$50, right? That's not even a huge move
for the stock itself. That's less than a
10% move for the stock. But what impact
would that have on the option? Okay, so
$50 move on the stock would be less than
10%. About 8% or so. Okay, I'll put up
the math. $50 move over the capital of a
stockholder, 100 shares, 593. You can
see the percentage that the stock would
have to move. But what impact would that
have on the option? Okay, so a $50 move
in the stock would essentially be moved
primarily by delta. So delta we have 68.
It's about 70. So let's call it 70.
Okay, when the stock moves up by $50,
then this option will increase by $50 as
well multiplied by the delta of.7. So
$50 *.7 is $35. So the increase in
option is expected to be $35 in this
example. Okay, there would be an
increase of $35. Now what impact would
that have in terms of a percentage
return off of the premium that you have
to pay? So in this example, what would
happen is the new price would be $175.
Okay? And I'm going to do the math right
now. $175 would be the the new value.
Okay? So 175 divided by 140 that's 1.25.
So essentially the option would
experience a 25% gain if Meta stock went
up by $50, which is less than 10%. It
was like roughly 8% or so, right? So in
this kind of rough math that I'm doing
which is roughly 8% on the stock move
the option experiences a magnitude
difference of a move and that's because
there is a lot of factors going on here.
Options are leveraged vehicles. The
premium here that I'm paying is a lot
smaller. So the impact that I'm getting
from a move on the stock although $50 on
the stock is a $35 move on the option.
That $35 is such a huge impact compared
to the capital that was being put up.
Okay. So in 3 months if Meta is up 50
bucks I don't have to hold this option
until expiration. I could simply close
out the option. Now 25% is obviously
amazing but for me I typically like to
have the option gain from 30 to 50% to
where I feel comfortable to close out
that option and take a gain from it. In
the description, you can actually see I
have a leaps challenge. And in my leaps
challenge, I'm making monthly trades and
I'm purchasing LEA options where I'm
simply buying and holding and waiting
for the position to profit. In my
previous leaps challenge over the last 7
months from January to July, some of the
plays that I have made, you can see on
the screen right now. One of my bigger
plays was AMD as well as these 11 other
trades that I purchased. And from
January to July, this is the amount of
capital that I used and this was my
ending challenge amount. If you want to
be part of my leaps challenge, it's
currently open right now.
Interactive Summary
Ask follow-up questions or revisit key timestamps.
Esta es una guía completa sobre el trading de opciones, donde el autor comparte sus secretos para lograr una rentabilidad constante y alcanzar la libertad financiera. El video cubre desde conceptos básicos, como los tipos de opciones (calls y puts), hasta estrategias avanzadas como la venta de puts, la estrategia de 'la rueda' (wheel strategy) y el uso de LEAPS. También se explica la importancia del análisis técnico (RSI, bandas de Bollinger, medias móviles) y fundamental, junto con una gestión prudente de riesgos, para maximizar las ganancias y minimizar las pérdidas en el mercado.
Suggested questions
4 ready-made promptsRecently Distilled
Videos recently processed by our community