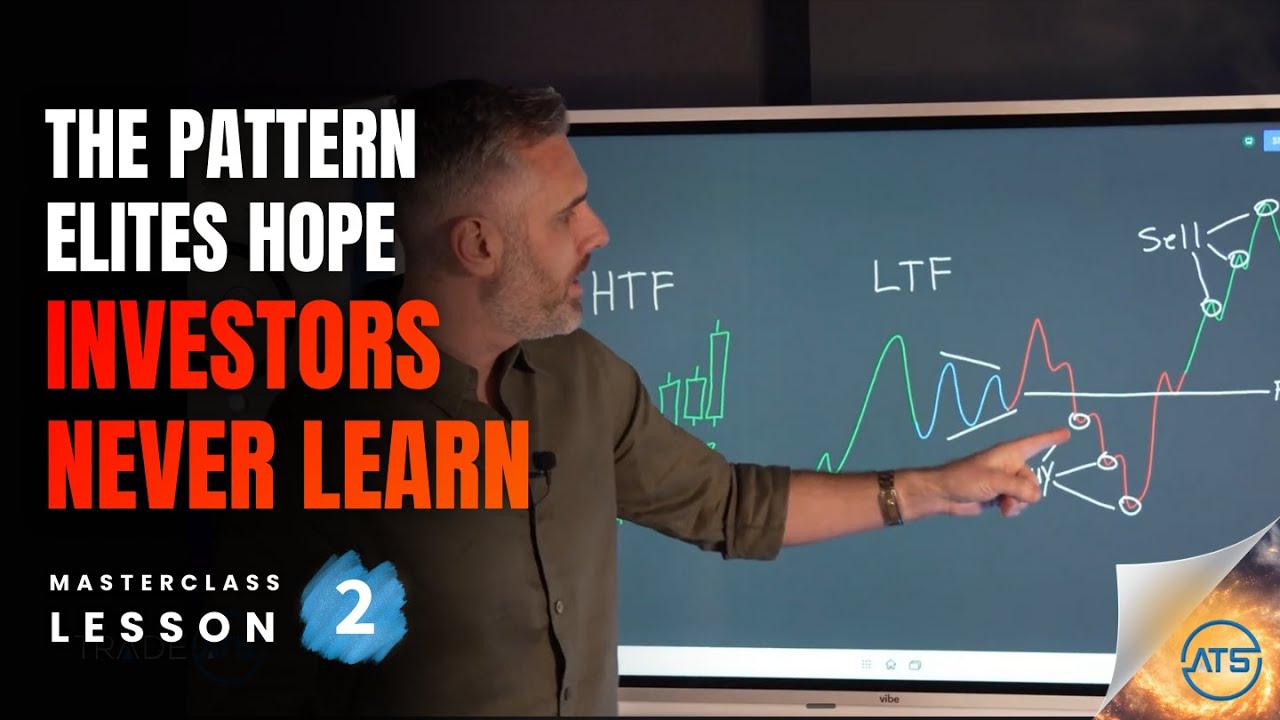
I Studied Charts for 10+ Years… This Is the Pattern Everyone Misses - Masterclass Lesson 2
Now Playing
I Studied Charts for 10+ Years… This Is the Pattern Everyone Misses - Masterclass Lesson 2
Transcript
483 segments
Let me show you something most traders
will go their entire careers without
ever noticing. Every time you pull up a
chart, no matter the pair, no matter the
time frame, there's a hidden structure
underneath the price. You won't see it
on indicators. You won't hear about it
in mainstream trading education, but
it's there quietly guiding every move
the market makes. Once you understand
this structure, you stop feeling like
the market is random, and you start to
realize that there's a very specific
sequence playing out over and over
again. I call this sequence the master
pattern. And after I walk you through
it, you're going to start spotting it
everywhere. In trends you thought were
messy, in reversals you thought were
unpredictable, even in those strange
whipssaw moments you could never quite
explain. It's all part of one repeating
cycle. And once you see it, you simply
cannot unsee it. I'm going to teach you
everything about this pattern and then
I'm going to give you a basic strategy
you can go use immediately. My name is
WDE Guth. I've been a trader for over a
decade and have taught this to literally
thousands of traders all over the world.
I own a specialized trading software
company called Trade ATS that thousands
of traders rely on to help them read the
hidden structure beneath all markets.
I've been around the block and I know
what I'm talking about. Now, before I go
any further, I want to be fully
transparent with you. I didn't invent
the market. I didn't invent price
action. I didn't invent the
psychological forces behind supply and
demand. What I did do, and what Trade
ATS has done for over a decade, is take
the pieces discovered by traders before
us and integrate them into one unified,
highly functional model. Traders like
Richard Wyoff and Jesse Livermore were
observing versions of this pattern as
far back as the early 1900s. In fact,
most of your smart money concepts gurus
and traders out there have been
influenced by what these 1920s traders
figured out long ago, whether they know
it or not. And good on them. It makes
sense that more people are starting to
finally look into these timeless
insights that have been handed down to
us. They're truly the foundation of
building the consistent approach all
traders are after. Over the years,
through tens of thousands of hours of
research, coaching, and real market
trading, I expanded the structure,
refined it, built a consistent
methodology around it. What I'm showing
you today is our interpretation of those
timeless observations, our framework for
understanding how markets truly behave.
It's simple. It's powerful. It's not
theoretical, and it works on every
single liquid market. Let me ask you a
real question. Why are you watching this
genuinely? Why did this video catch your
eye? If you're anything like the tens of
thousands of traders I've worked with,
the answer is somewhere between
curiosity and frustration. Because deep
down, you're still trying to make sense
of the chaos. You're still hoping
there's a structure that explains why
the market moves the way it does. And
you shouldn't feel bad about that. Most
traders spend years learning indicators,
patterns, systems, and strategies
without ever understanding the mechanism
that drives price. I have personally
coached traders who have been searching
for the holy grail strategy for
literally over 20 years. They felt so
much relief and clarity once they
learned what you're about to learn right
now. You know, when you think you've
found a great new strategy, but you
secretly have a pit in your stomach
because you doubt how long it may work?
Well, the master pattern completely gets
rid of that sick feeling. You won't have
it ever again. Here's why the master
pattern is different. It gives you an
objective explanation for every single
price movement the market makes. It
gives you a framework that never
changes. It gives you a way to think
like institutions, not react like
retail. It stops you from constantly
switching strategies or trying the next
new thing. It shows you how the market
is actually organized behind the scenes.
Once you understand this pattern, you
literally can't look at a chart the same
way ever again. Now, it's time to go
deeper.
[music]
All markets naturally organize
themselves into three distinct phases.
Most traders can't see this because
they're looking through fogged glass in
the form of multiple technical
indicators. But if they would simply
delete all of their indicators and take
a really long hard look, they would see
that the market operates in sequential
phases. And these phases are happening
in every liquid market and on every time
frame all the time. These phases are
what we call the master pattern. Phase
one is contraction. This is where the
market compresses. You'll see lower
highs and higher lows forming
simultaneously in what looks like a
wedge pattern. It's a tightening of
price, almost like a coiling spring.
[music] This is where buyers and sellers
are in balance. And this balance creates
what we call fair market value. Fair
market value is the most important price
on your chart. It's the level
institutions quietly anchor to. This is
also the area where beliefs about future
price start to neutralize. Since price
has paused and contracted into a tight
range, people are unsure of what's going
to [music] happen next. This creates the
perfect opportunity to manipulate the
masses, which leads us to the next
phase. Phase number two is expansion.
Expansion begins the instant price
breaks out of the contraction box. But
here's the part 95% of traders miss.
Expansion is not the start of the trend.
Expansion is the market's exploration
phase. One major thing is needed to
drive a trend. You need the higher time
frames to wake up and get involved.
Since the higher time frame players
operate on a longer outlook, they're
getting involved in a move will keep
price trending and stabilize the trend
at new levels. You could think of the
expansion phase as the marketing
campaign to recruit higher time frame
players to join a side. The expansion
also provides an easy environment for
the rapid accumulation of inventory for
institutions. This is the phase where
most traders get chopped to pieces
because they confuse expansion with a
breakout. Expansion happens for one
reason, to unlock the liquidity and
higher time frame commitments needed for
the real move. Phase number three is the
trend. This is the phase everyone wants.
It's the clean directional move. The
trend begins after the expansion has
completed its job. It's the orderly
movement away from previous fair value
to a new area where the market begins
the entire cycle over again. To recap,
the market phases are contraction,
expansion, and trend after which it goes
into a new contraction and repeats the
entire cycle over and over again. Now,
just to emphasize what I've been talking
about, I want to show you a quick
preview of what our software does, which
it basically spots all of the master
pattern cycles that are at play
currently in any market on any time
frame. So, right here, I have a 1 minute
chart in gold. You can see we have a
contraction [music] here. It goes into
the expansion phase, and we're working
with this fair market value. We also
have another contraction point here that
is also in expansion. So, we know
[music] that it's only a matter of time
before price picks a side based off one
of these fair market value lines and
goes into that trend phase. If we look
in the back here, here's a contraction
expansion [music]
and then it trends away from fair market
value. If you look up here, here's
contraction, [music]
goes into the expansion phase. There's
your trend phase, away from fair market
value. This is a cycle that I'm talking
about that repeats over and over and
over again. All you have to do is
[music] spot that tightening of the
market. Look for that tightening point.
Look for the expansion phase and mark
out your fair market value and work from
that level. [music] That's going to
really open your eyes to how these
markets really work. Now, I want to
shift gears a little bit to talk about
something that destroys more accounts
than bad risk management, bad entries,
or even fear. Changing. [music]
Changing strategies, changing
indicators, changing time frames,
changing markets, changing risk rules,
changing systems. Every time you see a
losing streak, every time you change,
you reset your learning curve. You start
over. I want to give you an analogy to
really make this stick. [music]
Imagine you're trying to become a great
basketball player. On Monday, you play
on a standard court. On Tuesday, your
court's shaped like a triangle. On
Wednesday, it's a circle. Thursday, it's
a zigzag. Friday, it's shaped like a
star. How would you ever master the
game? That's exactly what traders do
every time they switch strategies.
They're playing a different version of
the game every week. Meanwhile, the
banks, their court never changes. Their
rules never change. Their strategy never
changes. They don't wake up and switch
methods because they lost a trade. They
run the exact same playbook over and
over again because it [music] works. And
here's something to really think about.
When you run billions of dollars and
need to make a decent return to keep
your investors happy, you really don't
have a lot of flexibility in your
approach. You don't care what EMA
setting is the best for today's session.
All you're really interested in is how
to move the money of the crowd into your
account. And this comes down to waiting
for the overreactions, the
underestimations, and the [music]
mistakes of others. The master pattern
is the closest thing you will ever get
to the actual market court the bank
plays on. And once you commit to it,
consistency [music]
finally becomes possible. There's a
Federal Reserve working paper showing
that market depth, which is the amount
of available opposite side orders,
directly determines how price moves in
response to large trades. When there
isn't enough opposing liquidity in the
market, even a large institutional order
will cause much bigger price movements
because there simply aren't enough
resting orders to absorb it. In other
words, [music]
you can't generate big returns or
meaningful price movement unless there
is sufficient opposing liquidity
available to transact against. That
means the market isn't some
unpredictable random walk theorybased
machine. It's a liquidity dependent
machine where price moves only when
there's enough supply and demand to
actually trade. And here's another
powerful confirmation of what we teach.
In a 2020 interview, Ray Dallio, founder
of Bridgewwater Associates, the largest
hedge fund in the world, said, "Almost
all market movements can be explained by
cycles of accumulation and distribution
driven by liquidity needs." That's
literally what we call the master
pattern. It's accumulation, expansion,
and trend or distribution, and then it
repeats. The biggest players in the
world are publicly acknowledging the
exact mechanics this framework is built
on.
>> [music]
>> So now I'm going to show you exactly how
you can map out the master pattern on
your charts and do it in a really really
accurate way. And then as soon as I'm
done with that, I'm going to show you a
basic strategy that you can get started
with that will blow your mind. So first,
how do you find your contraction points?
Well, that's pretty simple. You look for
those areas where price is funneling
down and getting tighter and tighter.
That's the first clue. But that's not
the only thing you want to look for. The
next thing you want to look for is this
type of expansion activity where you in
this case we broke out of the low of
this range and then we break out through
the high right after. This is critical
because what this tells you is that the
sequence is in place. We have the
contraction, we have the expansion, that
exploratory phase and then at that point
you could draw draw out fair market
value and that'll be your pivot point
that you're working from. [music] So
this is the area that you want to look
for your best entries in. You want to
find your entries on these lows or these
highs as that expansion funnels out. The
critical part to this if you really want
to have a really nice way to map out
your charts is to look for displacement
between cycles. There's a lot of boxes
and a lot of contractions you could find
all over the chart. But you want to let
the cycle fully play out. If you
accurately identify this area and this
area, you know that it's only a matter
of time before we get that displacement.
Make sure you wait before you put
another box on your screen. So, as you
can see, we have the displacement and at
that point, we start looking for it to
start over again, which gives us a brand
new reference point that we could start
trading within those expansion legs.
This is the best way to do it. You don't
need to over complicate it. Just look
for this general type of activity and
you'll be on track. So, here's a basic
strategy that you can start implementing
right away. And believe me when I say
this, this can revolutionize your
trading overnight. Literally, it's a two
time frame setup that you want to use.
You want to have your higher time frame,
which is going to control your
directional bias or which direction
you're going to be trading in at any
given time. And then you're going to
have your lower time frame, which is
where you will enter and exit the
market. A lot of people ask, well, what
time frame pairing should I use? For day
traders, scalpers, a 4 hour and a 5
minute works really good. If you're
going up on the time frames, a daily and
a 30 minute or a daily and a 15-inut
works well. If you go up above that, you
start getting into a weekly and an hour
or a weekly and a 4 hour. And then up
above that, you're going to start
getting into the the monthly and the
daily or a monthly and a 4 hour also
work too. But you can kind of feel
around for what works for you in regards
to that. So we have our higher time
frame and our lower time frame. Here's
the magic. Here's what makes this so
special is the higher time frame. You
don't need to overthink this. We're just
looking for where that overall flow of
money is going. But when you define that
fair market value like we just talked
about and the master pattern phases, you
know what's coming next. You know the
market is typically going to contract.
You know it's going to expand. But the
trick here, which is almost like insider
trading, is this higher time frame gives
you the knowledge of where the
displacement or that expansion phase is
likely to result. And in this case, if
the higher time frame is going up,
that's the stronger flow of money, the
more stable flow of money. We know that
the distribution or the trend phase is
likely one way or another going to leave
this level and go up to here. So how do
we trade that? We get our contraction
phase. We mark out our fair market
value. We look for those first two legs
of expansion. And since we know where
the market is fairly valued and you know
the trend is overall going up. If you
buy below that value, there is a very
very very high chance that these
positions will return to fair market
value. This is your money in the bank
because once you get above fair market
value, the price has revalued to what it
should be in trend. This right here is
all on the house's money. So, you should
be trying to buy under fair market value
and then sell above fair market value.
Now, when you do this, the basic
strategy, this puts you in line with how
the banks trade. Let me explain how real
fast. When the banks are trading,
they're looking for people to make the
wrong decision so that they can take the
other side of the liquidity. When we get
below an equilibrium point like this
that's expertly mapped out, then you get
traders that think the move is over and
they're going to sell below fair market
value. What that does is it creates a
pool of people that are likely making
the wrong decision. So when you time
your entries with these phases, you
accumulate in the same areas the banks
are accumulating because it just makes
sense to the banks know that this trend
is not over. There's so much higher time
frame momentum pushing it. It's not done
yet. So anybody that sells right here is
there's a highly likelihood that they
are going to lose. Therefore, you want
to trade with them. So as you accumulate
from those people, you match what the
banks are doing. And then as it goes
above fair market value, the opposite
happens. Traders rush in in a in a FOMO
uh inspired manner. They start buying up
the market cuz they're always chasing
and then you sell to them. So you are
buying from traders that are thinking
that the trend is over when it's not.
And then you are selling to traders that
are rushing in in FOMO. Therefore, this
fair market value and this model puts
you always opposite to the dumb money.
That's the magical moment. That is
incredible and that's why this works so
well. Here's what I want you to take
away from this lesson. Price in every
market is always in this cycle. And
every candle belongs to one of those
three market phases. When you understand
the cycle, you start to understand the
intention of the institutions that run
price. And when you understand the
intention, you can anticipate price in a
way most traders will never experience.
Your win rate, your confidence, and your
consistency are all tied to one thing.
how accurately you could identify the
phase the market is in. Master this
framework and you'll no longer feel like
you're trading in the dark. You'll be
reading the market the way institutions
do. That's the end of lesson two. If you
found this information valuable,
remember to like and subscribe. We're
going to be dripping out the rest of
this master class over the coming weeks.
So, make sure that you don't miss out on
that. If you are interested in what we
do at Trade ATS, make sure you check out
the links in the description. You visit
our website and check out all of our
cool stuff that we have there for you.
Until next time, we'll see you on the
next video.
Interactive Summary
Ask follow-up questions or revisit key timestamps.
This video introduces the 'master pattern,' a recurring cycle of three market phases—contraction, expansion, and trend—that the presenter argues dictates all institutional market movements. By moving away from traditional technical indicators and instead focusing on identifying these phases and fair market value, traders can align their entries and exits with institutional behavior. The video also provides a practical two-time-frame strategy to help traders gain a consistent edge by trading against retail sentiment.
Suggested questions
3 ready-made promptsRecently Distilled
Videos recently processed by our community