The "AI Bubble"
Now Playing
The "AI Bubble"
Transcript
502 segments
One of the benefits of index investing
is supposed to be broad diversification.
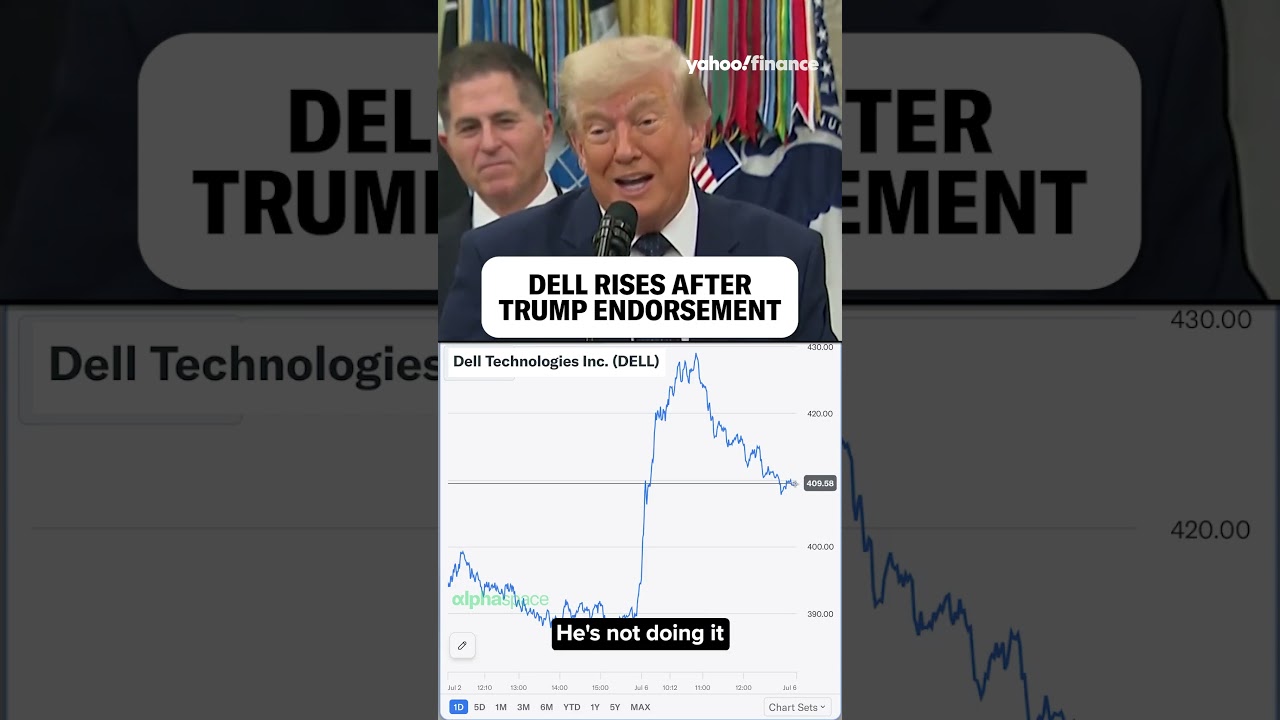
But right now 36% of the S&P 500 index
consists of just seven stocks. If we
look at the total US market, that number
is 32%. That is the most extreme level
of index concentration in US market
history going back to 1927.
US stock market valuations are also
nearing their 1999 peaks which were of
course followed by a decade of flat at
best US stock returns. I get it. This
does seem concerning. If that handful of
stocks declines in value, the effect on
the overall market could be substantial.
This is a movie we have seen before up
here in Canada. In July of the year
2000, one stock made up about 36% of the
entire Canadian market index,
subsequently crashing, eventually
becoming worthless and dragging the
market down with it. The good news is
that mitigating the worst of these
situations is not actually that hard.
I'm Ben Felix, chief investment officer
at PWL Capital, and I'm going to tell
you how to prepare for the aftermath of
the AI bubble.
[Music]
All
right, I've got to come clean up front.
I don't actually know if there is an AI
bubble. Nobody does. That's only
knowable in hindsight. That being said,
some wild stuff has been happening in
the US stock market. Companies have been
spending at a blistering rate to build
out the infrastructure needed to
capitalize on the supposed AI
revolution. This type of spending often
coincides with the development of
revolutionary technologies. Railroad and
internet stocks followed a similar path
of high asset prices, massive
investment, and an eventual painful fall
in asset prices, which we might describe
as a bubble after the fact. Stock price
bubbles, or periods of unusually high
stock prices followed by much lower
prices, are an age-old feature of
financial markets. They are often, but
not always, sparked by some new
technology that promises huge profits
for those developing it. The history of
technology bubbles goes back to at least
the 1700s and has followed a similar
pattern with each successive major
technological innovation. In this video,
I want to talk about the two main
features of the current US market which
seem to be causing some investors to
worry. One is market valuations. The
other is market concentration. These are
two loosely related measures. Market
valuations measure how expensive it is
to buy the expected future earnings of
companies. And market concentration
measures how concentrated the market's
total value is in a small number of
stocks. High market valuations are
generally associated with lower future
returns, while market concentration has
a much noisier relationship, if there's
any relationship at all. Market
valuations and market concentration may
both increase around the development of
new technologies simply due to the fact
that as some companies rise in value due
to their association with the new
technology, they will make up a larger
portion of the market. Bubbles are
exciting on the way up, often inducing
FOMO, fear of missing out that may
further feed into the bubble dynamics,
and then they are painful on the way
down, both psychologically and often
economically or financially for the
people who invested in them. Bubbles are
not all bad, though. High stock prices
that arise from speculation about the
profitability of a revolutionary
technology can help to facilitate that
technologies development and deployment
into the economy. Classic examples are
the massive spending on installing fiber
optic cables in the late '90s and on
installing railway track in the 1840s.
In both cases, many of the companies
involved were able to raise a ton of
money and achieve temporarily high stock
prices as excited investors piled in,
but their share prices subsequently
crashed. Bubbles do tend to come with
waste. Too much unused fiber optic
cable, too much redundant railway track.
But despite the waste, the
infrastructure for the respective
technologies does get created, paving
the way for a potential economic golden
age to follow. These productive bubbles
are probably on net a good thing for the
economy, even if they can be painful for
investors. The pattern of investor
excitement and high stock prices
surrounding technological revolutions or
potential technological revolutions goes
back hundreds of years and it always
follows this similar path. Stock prices
are driven up by some combination of
high profit potential from the
revolutionary technology and once it
starts rising, speculation that the
associated stocks will continue rising.
Eventually, prices do come back to
Earth, resulting in low returns for
anyone who bought near the top. Whether
that's what we're seeing in the US right
now, again, can only be known in
hindsight. Prices could remain high. The
rapid rise in prices of the top US
stocks has also been accompanied by
rapid earnings growth. It's not pure
hype. There is some economic substance
here. What we do know is that a large
portion of the US market's return,
earnings growth, and capital expenditure
has come from AI related stocks since
the launch of Chat GPT. A September 2025
report from JP Morgan explains that AI
related stocks have accounted for 75% of
S&P 500 returns, 80% of earnings growth,
and 90% of capital spending growth since
CHACPT launched in November 2022. We
also know that US stock market
concentration which was already high has
shot up even further. Stock market
concentration and high stock valuations
are again different issues but they can
be related by the fact that a rapid rise
in valuations for a small number of
firms can also lead to market
concentration. To be completely clear in
case I wasn't already, I am not taking a
position on whether we are witnessing a
bubble in the US stock market. But I
think it's useful to look at past
instances of high stock market
valuations and market concentration to
understand the potential implications
and lessons. The Canadian example that I
mentioned earlier is even more extreme
than what we're currently seeing in the
US market. Northern Electric and
Manufacturing Co. was spun off from Bell
Canada in 1895.
In 1998, it was renamed Nortell
Networks. During the dotcom bubble,
Nortell's early work in optical
networking technologies propelled it to
the forefront of the internet
infrastructure revolution. It was making
truly useful stuff that the world needed
or thought it needed. Its stock price
soared, creating huge amounts of wealth
for investors and for the many employees
who received stock-based compensation.
Incredibly, the company peaked at over
36% of the Canadian stock market index
at the time called the TSSE 300. Nortell
and thus the Canadian stock market had
extremely high valuations in August of
the year 2000, peaking at a Schiller
cyclically adjusted price earnings ratio
of 60.62, far surpassing the peak
valuation of the US stock market during
the same dot period. The Schiller
cyclically adjusted price earnings ratio
measures market prices against the
index's 10-year average real historical
earnings on the assumption that
long-term earnings growth tends to be
steady. A high Schiller PE means that
investors are paying a lot more for
future earnings and should therefore
expect lower future returns unless
earnings end up being unusually high in
the future which can happen. Nortell's
downfall started with a string of
unprofitable internet related
acquisitions and was accelerated by the
dotcom bubble popping. The result for
the Canadian stock market was
devastating. The Canadian TSE 300 index
dropped by 43% between September 2000
and September 2002. Pat obviously hurts.
There are two lessons that I think are
important to explain here. First, while
this drop was definitely painful. I
don't want to minimize that. The market
recovered by July 2005 and it went on to
deliver strong returns while the US
market, as I'll detail in a minute,
struggled for more than a decade.
Despite having been more concentrated,
the Canadian market was more resilient
than the US market. The Nortell crash
was, in hindsight, a short blip in a
long track record of strong performance
for Canadian stocks. Second, while the
Canadian market as a whole was hurt by
its exposure to Nortell, Canadian value
stocks, a Canadian value stock index, so
stocks with low prices relative to their
fundamentals, did not crash when the
overall market did, and it actually
delivered even stronger returns than the
market on the recovery. This will come
up again in my next examples, too. The
US market did not have such extreme
concentration in 1999 as it does today
or as Canada did back then. But it did
have high stock prices which were in
hindsight mostly unjustified by
fundamentals. Some companies like
Microsoft and Amazon came through the
other side and proved that there was
real transformational potential in the
internet. But the vast majority of
companies that tried to capitalize on
the internet failed. This led to the
famous dotcom bubble and the subsequent
lost decade for US stocks. The US market
crashed starting around March of 2000
and measured in Canadian dollar terms
remain flat or below flat until July of
2013. That is another brutal period of
technologyinduced high prices leading to
low realized stock returns for investors
who bought at the peak. In this case,
unlike with Nortell, the recovery was
not so swift. Part of the problem is
that the great financial crisis
intervened as stock prices were starting
to recover. Either way, this technology
bust was painful for US investors or
investors in US stocks in general and
even more so for investors focused on US
technology stocks. It would have taken
them even longer to recover. Similar to
the Canadian example, an investor in US
value stocks and to an even greater
extent, US small cap value stocks fared
much better over this long period of
poor performance for the market as a
whole. They earned positive returns
while the market was flat at best for an
extended period of time. It's also worth
reiterating that Canadian stocks
performed reasonably well over this
period. Diversification is known as the
only free lunch in investing for good
reason. The main problem with
diversification is behavioral. It
inherently means that you always own the
stuff that's performing well and the
stuff that's performing poorly, which is
not always so easy to do. Okay, so these
two examples, the Canadian and the US
example, they had high market valuations
in common, but the Canadian market
became much more concentrated than the
US market. In the past, the US market
has reached high concentration levels
without going on to deliver poor future
returns. Not quite as high as today, but
still high. I looked at this within the
US market going back to 1926. I sorted
10-year future returns on the starting
level of market concentration in the top
seven stocks. There's a very slight
negative correlation between market
concentration and future returns, but
it's not statistically significant,
meaning there's a good chance it's just
noise in the data. But statistical
significance aside, it's still a weak
relationship economically. A point that
often seems to get lost in discussions
of the US markets concentration is that
many other markets around the world are
far more concentrated. I mean, I gave
you guys the Canada example, and yet
they still managed to deliver positive
returns, in some cases even more so than
the US market. Looking back at the last
10 years of returns, just as an example,
the weight of the top seven stocks in
the 10 largest stock markets, excluding
the US, was 40.94%.
So higher than the US in November 2015,
so we're looking back 10 years in
history. Switzerland was the most
concentrated market at 60.11% in the top
seven stocks, and Japan was the least
concentrated at 16.91%.
The return from November 1st, 2015 to
November 26, 2025, measured in USD was
8.44% on average for all of these
countries. That does trail the US market
return, but still delivers a
meaningfully positive equity risk
premium. Taiwan was one of the most
concentrated markets in November 2015,
and it outperformed the US market over
the subsequent 10-year period. The
overall relationship between market
concentration and future returns across
countries seems to be noisy at best. An
interesting sort of anecdotal
perspective is AT&T which was broken up
into smaller companies starting in 1982.
It was the largest company in the US
market at that time and in prior decades
not when it was broken up but in prior
decades it made up a larger portion of
the US market than Nvidia makes up
today. The interesting question is was
the US market less risky after the
breakup? I think that would be pretty
hard to argue. You could maybe even
argue the opposite. Something that does
appear in the data at least post 1950 is
the returns can suffer over periods
where concentration is falling. I think
this again makes sense. If concentration
comes from rising valuations for a
handful of firms, falling valuations for
those firms would lead to lagging
returns. But even then, we're talking
about less positive returns, not a total
disaster. The relationship between
market valuations and future returns is
stronger, at least economically, both
across markets and within the US market.
To illustrate this, I looked at the
relationship between the starting
cyclically adjusted price earnings
ratio, the CAPE ratio, and the 10-year
return for the 10 largest developed
stock markets going back to 1982. I
looked at rolling periods with a one-mon
step. I acknowledge that there are
potential problems with this setup, like
difficulties in comparing the cape ratio
across countries. And from a statistical
perspective, the fact that I'm using
these overlapping samples, the rolling
periods of the one-mon step, it does
make any conclusions drawn from the data
statistically questionable. Now, that
being said, there is a clear monotonic
relationship between starting cyclically
adjusted price earnings ratio, so
starting valuations, and future 10-year
returns. When the cape ratio is higher
at the start, future returns are lower.
Again, this does not mean that the
market must crash tomorrow or next week
when valuations are high, but it might
mean that it makes sense to moderate our
expectations for future returns from the
US market in particular due to its
currently elevated valuations. The
Japanese stock market had a crazy run
leading up to 1990, eventually becoming
the largest stock market in the world by
market capitalization, surpassing even
the US market for a period of time.
Japan was viewed as this unstoppable
economic powerhouse and its stock market
valuations reached levels rarely seen
elsewhere in history. I'm not saying the
US is today's Japan, but I think it's an
important example to think about. At the
end of 1989, the Japanese market did
crash. So, it had these crazy high
valuations and then it prices do start
to come down. The market really does
crash. The crazy thing about the Japan
example though is that it has not
recovered in real terms. So if we adjust
for inflation to this day, so it crashes
in the end end of 1989 and now we're in
almost 2026 and if you adjust for
inflation, the Japanese market is still
not recovered from the crash or it's
it's flat after the crash. Now two
things would have saved an investor in
Japanese stocks in 1989. diversification
across markets. A globally diversified
investor did just fine as the US market
kind of took the torch of stock market
dominance back from Japan with a a
vengeance. The US went on to absolutely
uh perform exceptionally well as Japan
had done previously. And then the other
thing that would have helped is
diversification within the Japanese
market itself. Despite Japan's stock
market struggles over this long period
of time, as with my previous examples,
Japanese value and small cap value
stocks have actually performed fine over
this period. Now, again, this does not
mean that I'm suggesting getting out of
the US stock market. I we could have had
a very similar conversation to what
we're having now in 2021 when US market
valuations were high again, not quite as
high as today, but still high. Uh that
would have been a mistake. US stock
returns have continued to be very
positive since then. But what it does
mean is not expecting the same rocket
ship returns that the US market has been
delivering to continue forever. The US
stock market currently has these two
defining features that are causing some
investors to worry. High stock
valuations and high market
concentration. Market concentration,
while seemingly problematic due to the
potential impact of a few large firms
faltering and bringing the market down
with them, has not historically been as
much of an issue as you might expect.
Anecdotally, the Canadian market
recovered from extreme period of market
concentration and high valuations during
the do-com bust more quickly than the
less concentrated US market. Looking
more broadly at the 10 largest non US
stock markets for the last 10 years, the
relationship between concentration and
future returns is seemingly
non-existent. Looking at US returns from
1927 to 2024, there is a weak economic
relationship that is not statistically
significant between market concentration
and future returns. Stock market
valuations on the other hand are more
impactful and that is another concerning
aspect of the US market right now. High
current valuations, while not a perfect
predictor of future returns, do seem to
be at least somewhat related. This
relationship, while it's economically
strong, doesn't really hold up to
statistical scrutiny for the simple
reason that we don't have that many
independent samples to draw conclusions
from. Past market valuations tell us
only a little bit about the future. It's
always possible, as the US market has
demonstrated in recent history, for high
valuations to be followed by high
returns and continued high valuations.
Even if history tells us that that is an
unlikely outcome, it is what we have
seen. The main lessons from the
information in this video, I think, are
diversification and discipline, which I
think are related. A properly
diversified investor should be
comfortable sticking with their
portfolio through good times and bad,
knowing they will always hold the
losers. You have to accept that whatever
is not doing well, if you're
diversified, you probably own that. But
you also own the winners. And people who
are comfortable with their investment
strategy understand that the winners
that they own are going to have an edge
over the losers in the long run, which
is something that has been true
throughout history. Thanks for watching.
I'm Ben Felix, chief investment officer
at PWL Capital. If you enjoyed this
video, please share it with someone in
your life who's concerned about the AI
bubble.
Interactive Summary
Ask follow-up questions or revisit key timestamps.
The video discusses concerns about the current US stock market, specifically high valuations and market concentration, which are reminiscent of past tech bubbles like the dot-com era. While acknowledging the potential risks, the speaker, Ben Felix, emphasizes that history shows these situations don't always lead to disastrous outcomes. He uses examples from Canada (Nortel) and the US (dot-com bust) to illustrate how markets can recover, and how diversification, particularly into value stocks, can mitigate losses. Felix also examines international markets, finding that high concentration doesn't consistently correlate with poor future returns. He concludes that while high valuations are a stronger predictor of lower future returns, they don't guarantee a market crash. The main takeaways are the importance of diversification and discipline for investors to navigate market fluctuations.
Suggested questions
9 ready-made promptsRecently Distilled
Videos recently processed by our community