How Long Can The Stock Market Ignore Reality?
Now Playing
How Long Can The Stock Market Ignore Reality?
Transcript
522 segments
The market can stay irrational longer
than you can stay solvent, but it can't
stay irrational forever, right? [snorts]
You are probably already aware of the
headlines that stocks are trading at
record values relative to the underlying
businesses they represent. Some of the
most valuable companies in the world
today will take hundreds of years to pay
back their investors, and those are just
amongst the ones that still bother
making a profit at all. The only way
this makes any sense is if the future
turns out to be some kind of uh
corporate utopia where our god-like AGI
lowers interest rates, doubles consumer
spending, and covers every square inch
of the planet and lower Earth orbit with
Nvidia GPUs. A slight exaggeration, but
only slightly. We have been told that
the market is effectively pricing in
perfection, which means if things don't
go perfectly well, we should be in for a
major correction, right? The only
problem is that we are currently in an
active oil war, our reserves are getting
dangerously low, inflation is already
coming back up, interest rates are
probably going to need to rise impacting
ballooning national and consumer debt,
all on top of two years of trade
uncertainty, questionable economic
results from one of the largest
investments in history, the potentially
systemic issues in financing vehicles
holding it all together, and then as a
little cherry on top, we decided to
throw another 50% tariff on Canada this
week because it worked out so well the
first 12 times. Now, I know none of
these are a surprise to any of you
watching anymore, but every single one
of these events can and will impact
companies' top-line revenue, operating
costs, and ongoing expenses. So, you
know, basically the entire income
statement. At the very least, this is a
pretty bumpy road towards that
supposedly perfect financial future, and
a lot of assets, even safety assets,
have naturally fallen based on these
headlines. Housing is down across broad
parts of the economy and the world, gold
has fallen by 25% from its all-time
high, and other speculative staples are
barely even worth mentioning. But the
stock market keeps on chugging. So, is
there something behind this endless boom
that makes the market immune to all of
these problems, or has it just not had
the time to look down yet?
>> The Dow Jones Industrial Average closed
above 50,000 for the first time ever on
Friday.
>> The US housing market is slowly dragging
itself into 2026. [music]
Earlier, mortgage rates hitting their
lowest levels since last October.
>> Have you been going on Zillow lately and
just seeing price cut after [music]
price cut? Well, it's pretty common.
>> Some record drops are is what we're
seeing in the metal space [music] as
that precious metal rally that we've
seen all year long. Gold is now down 5
and 1/2% on the month.
>> The Trump administration is praying that
the third time's the charm when it comes
to the president's tariff agenda.
>> White House has launched another
escalation of the trade war between the
US and Canada.
>> The Dow is over 50,000
right now.
>> Okay, so there is a logical temptation
to compare today's market to the dot-com
bubble of the late 1990s and the early
2000s. Both saw a significant market
rally fueled by speculation over new
technology, major infrastructure
investment, circular financial dealing,
all ultimately giving rise to companies
with questionable fundamentals. But that
comparison is probably a bit unfair to
the dot-com bubble. Back then, the
economy was in a much better position.
Debt across the board was lower, the
market was far less concentrated. There
was, at the time, less geopolitical
uncertainty, and outside of the dot-com
companies themselves, speculation was
actually pretty tempered. So, surely we
are overdue for a similarly massive
correction when we get to the end of
this particular fuse, right? Well,
maybe. And honestly, if it wasn't for
all of our livelihoods tied to this line
going up, there's a good reason to kind
of want these companies to be put back
in their place a little bit. But
assuming or even hoping that a crash is
inevitable can also tempt us into only
reading the information that reaffirms
what we already want to hear, rather
than challenging it. People have been
saying that the market is due for a
major correction since 2010. And so far,
they have been wrong. Being early has
also been expensive. The fund manager,
John Hussman, has been forecasting
[music] a collapse of 40% or more almost
every year since 2013. And well, over
that period, the market has spent that
entire time compounding at roughly 13%
per year. Had he actually put his money
where his mouth is, he would have wiped
out his fund several times over. Now,
obviously, this is all easy to say in
hindsight. But how is it possible that
we can still argue with a straight face
that all of this isn't overdue for a
correction? Well, a few reasons. The
first is the concentration risk.
Compared to something like the dot-com
bubble, the stock market is
significantly more concentrated now. In
2000, the top 10 companies in the S&P
500 accounted for roughly 10% of its
total market cap. Today, they account
for 40%. Now, that might sound like a
bad thing. It's a risk [music] that such
a large chunk of the stock market is
tied up in these companies. But it also
means that a large chunk of the market
is tied up in these very large
companies. As in, as opposed to hundreds
of new pre-profit listings that had a
much larger share of the overall market
back in the late '90s. Obviously, if one
of these failed, the overall impact on
the market would be devastating. But
they are much less likely to fail
because they all have a real market. The
top 10 generates around 30% of the
index's actual operating profits, which
was uh
not exactly the situation with the class
of 2000. After the dot-com bubble burst,
the market leaders all lost value. But
their overall share of market value
actually increased as hundreds of
companies eventually got acquired,
delisted, or went bankrupt. The number
of listed companies in America peaked at
more than 8,000 in the late '90s. And
over the next decade and a half, roughly
half of them disappeared. The
concentration in the market today is
probably not a great thing for society.
But for investors, it might not really
be as bad as it might look. We might
have put our eggs all in just seven big
baskets. But those baskets are far more
secure and well-constructed than the
hundreds of packing peanuts that made up
the market in the dot-com era. Now,
let's assume, hypothetically, AI
completely flops tomorrow. Take a
worst-case scenario where there is
definitive proof that we will never
reach AGI, and on the same day China
releases another deep seek style
open-source model that beats the leading
American models and can run on a laptop,
completely negating the need for those
data centers. Well, even in that kind of
extreme case, all of the Magnificent
Seven would still make money. Only
Nvidia has a really significant share of
its business tied directly to selling
the technology itself. Last quarter, 75
of its $81 billion in revenue came from
data center hardware. Their financials
don't report it in detail, but from the
best available sources we could find,
the remaining 6 billion came directly
from selling a single 5090 at market
prices. So, well, yeah, they would
probably take a hit if the AI investment
cycle stopped, but the rest of these
companies still make their actual money
by selling ads, cloud subscriptions,
iPhones, and the big promise of enhanced
cruise control. The point is, for all of
these companies, AI is mostly an
expense. If anything, a total
abandonment of AI tomorrow would
actually improve their earnings. Less
money going towards data center
build-outs, crazy salary packages, and
infrastructure depreciation means they
could go back to being asset-like cash
flow monster doing big stock buybacks
every quarter, you know, like the good
old days. And yeah, with some outliers,
most of these mega-cap companies aren't
actually that stretched in terms of
historic valuation. And that's again
based on earnings tied down by
significant AI expenses. Despite what
simple visuals like this and this might
suggest, there are still large voices in
the finance space that actually consider
these companies to be cheap. And again,
even if you don't personally think this
makes sense, the market doesn't really
care what you think. But that also
doesn't mean that this can go on
forever. So, it's time to learn how many
works to find out how long the rest of
the market can ignore reality. P/E
ratios are stretched, earnings growth
isn't keeping up with prices, and
there's no shortage of reasons for
investors to be nervous. And yet, the
market just keeps climbing anyway, which
raises the obvious question. Is this
actually fine, or are we all just
choosing not to look too closely? The
tool I use is Investing Pro from
investing.com, the sponsor of this
video. We used Investing Pro while
researching this video. We compared a
group of stocks in the sector, and it
maps every company on a chart by revenue
growth against PE ratio. And you can
immediately see which ones are priced
way ahead of their fundamentals. That is
the kind of disconnect you completely
miss when you are looking at stocks one
at a time. From there, you get your fair
value on each stock, which combines
multiple valuation models, discounted
cash flow, earnings based, peer
comparisons, and shows you whether it is
trading above or below the fundamental
support. Then, there's the financial
health score, which breaks down
profitability, cash flow, and growth
side by side. It also lays out the macro
factors driving those numbers, so you
can see how interest rates, earnings
revisions, and sector rotation are all
feeding into the prices that you were
looking at. None of this tells you what
to buy. That is still your decision, but
it gives you access to the kind of
valuation data professionals pay
thousands of dollars a year for.
Investing.com is running their summer
sale, up to 60% off, the best price of
the year. If you use my link below, you
get an extra 15% on top of that, meaning
the lowest price available the whole
year. Use my link in the video
description.
Okay. So, regardless of whether this is
an AI boom or bubble, these companies
are probably less exposed than the
overall economy is. If that technology
pays off, great. These companies get to
sell high-priced software subscriptions
and girlfriend bots as a service, all
ultimately expanding the revenue and
bottom line. If it doesn't, well, maybe
that's also great, and these companies
can get back to business as usual,
cutting out AI expenses and growing
their bottom line. Now, of course, these
aren't the only companies in the market.
And all of the mega IPOs that were
slated for this year don't have the same
foundation of real revenue underneath
them. but two-thirds of them aren't on
the market yet. And the one that is on
the market is already repricing itself,
which is thoughtful, I suppose. The
point is the market is apparently still
perfectly capable of repricing
something. It just hasn't felt the need
to reprice everything. There are certain
corners of the finance space that
genuinely consider the current roster of
the Mag 7 to be cheap. Usually, the
biggest companies in the market trade at
a significant price to earnings premium
over everybody else. This is because
bigger companies are usually more
diversified, they have more brand
awareness, and well, they got that
valuable for a reason, usually by
dominating their particular market. For
most of the last half century, that
premium was between 50% and 100%. In
plain English, people will generally pay
at least 50% more for Google shares,
even if they were representing the same
earnings as a broad selection of smaller
tech or advertising-based companies.
Today, the Mag 7 still trades at a
higher price to earnings ratio than the
other 493 companies in the index, but
the premium has shrunk to around 10%.
The thinnest it has been in more than a
decade. And if you exclude Tesla, the
gap gets even smaller still. Now, that
shrinkage has mostly come from these
companies just making a whole lot more
money. Mag 7 profits grew 63% in the
first quarter of this year, while the
other 493 companies grew about 17%. And
since they collectively make up such a
large share of the market, that would
make it very hard for the whole thing to
fall too far, right? Well, good value
compared to the rest of an extremely
expensive market. So, yeah. Cheap is a
relative term, but markets mostly run on
relative terms. And the problem for a
lot of these investors is that the
alternative to buying one stock is
usually just buying a different stock.
And statistically, these companies have
outgrown the economy that produced them.
Theoretically, the stock market depends
on the overall performance of the
economy because companies are
participants in that economy. No matter
how revolutionary its products are, a
company that can only operate within the
city limits of Ardmore, Oklahoma, is
naturally limited in how much it can
grow. America, fortunately, has a very
big economy, but we have even bigger
companies. For most of our recent
history, public companies had a
collective market cap of around 50% to
100% of the country's annual economic
output, meaning that the value of all
the listed companies in America were
worth about as much as America's total
annual GDP. Again, this makes sense
since the revenue and by extension their
profits and ultimately valuations are
part of that gross domestic production.
Today, the total value of American
public companies is currently sitting
around 234% of GDP, beating the previous
ratio record set in 1999. Yeah, at the
height of the dot-com bubble. Warren
Buffett once described a version of this
ratio as probably the best single
measure of where valuations stand. And
on that measure, the current market
makes 1999 look responsible. So, not a
great sign, right? Well, a lot of people
are actually arguing the opposite. More
than at any other time before, our
companies are global. They reach across
the planet for their customers and
increasingly for their investors, too.
When a company's revenue comes from
everywhere, a local disruption, a tariff
here, a housing slump there, doesn't
really matter as much as it did when
American companies overwhelmingly sold
things to Americans. The relative weight
of these companies in our economy also,
somewhat perversely, highlights the
bulls' last major defense. If current
stockholders sold their shares, what
would they actually do with that money?
The largest group that owns the vast
majority of these assets are ultimately
wealthy people with more money than they
need.
>> Say the line, Bart.
>> According to the Fed's own numbers, the
top 10% of American households own about
87% of all the corporate equities and
mutual fund shares in the country. The
bottom half owns 1.1%.
>> Yay!
>> So, the decision to sell or not sell
belongs to a fairly small group of very
comfortable people who have other ways
to access liquidity if they need it and
nowhere else better to invest it in the
meantime. If a wealthy holder needs cash
these days, the standard move is to
borrow against the portfolio and keep
the shares. Investors are currently
carrying a record $1.42 trillion in
margin loans, according to the
industry's own regulator. Morgan Stanley
CFO Sharon Yeshaya spent parts of a
recent earnings call pointing out that
80% of their client households now
borrow against their accounts, up from
14% 5 years ago, with lending balances
at $186 billion and climbing. And for
the few who actually might want out, the
alternatives are not exactly making the
case. Bonds finally pay decent interest,
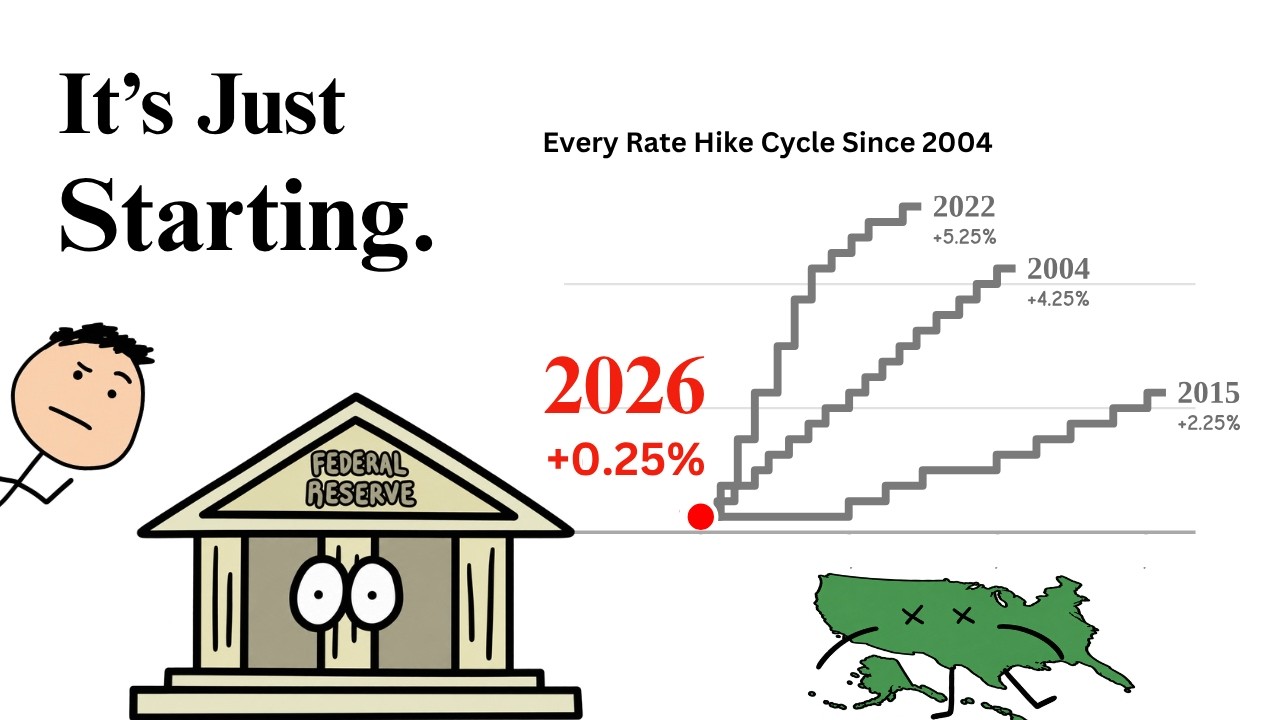
if you trust that rates are done rising,
while roughly half of the Fed's own
committee is openly talking about hikes.
Housing has been falling in real terms
for 11 straight months, and falling
outright in a growing list of cities.
Gold was supposed to be the responsible
adult in the room, and you already know
how that's going. And Bitcoin is
currently worth about half of what it
was in October of last year. A symptom
of having so much financial wealth tied
up amongst such a small group is that
unlike regular people who might need to
sell their assets to cover over
shortfalls in other parts of their
financial lives, that doesn't really
happen with people at this level. So,
the only reason they would need to sell
is if a better investment opportunity
came along. And at the moment, there
aren't any. Now, we have spent a lot of
time in this video looking at how much
money the collective stock market is
worth, but nobody ever stops to ask how
much stock market the collective money
is worth. The total US stock market is
currently priced at around $74 trillion.
The M2 money supply, which is basically
every physical dollar, checking account,
and savings balance in the country is
about 22.7 trillion. Asset prices have
obviously climbed bigly since the
stimulus measures kicking off in 2020,
and that has largely been attributed to
a lot of money trickling up to people
who simply invested it. But, even with
all of that extra money acting as a
denominator down here, the market is
still seeing a higher share of it than
almost any time before. Last year, the
total value of the stock market crossed
three times the amount of actual money
in circulation, and it has kept drifting
higher since. Today the ratio sits
around 3.3. The only time this ratio has
ever been anywhere close was the run-up
to the dot-com bubble. Now that's not a
great sign, but again the argument today
is that these companies have just
outgrown their host economy and compared
to the money in the global economy their
value still looks relatively modest, at
least compared to that other bubble. But
we should also probably address the
curious case of South Korea. The KOSPI
roughly doubled in 6 months powered by
two chip companies, Samsung and SK
Hynix, that between them make up about
half of the entire index. These are real
companies making real profits with real
customers all over the world, well
beyond the confines of their home
economy. But even still over about three
and a half weeks their market still fell
25% complete with repeated emergency
trading halts and about 1.7 billion
dollars in forced liquidations. For what
it's worth, as of this week the market
has bounced back above 7,000 with city
already calling the whole episode uh a
technical correction and a potential
buying opportunity. Now my good friend
Patrick Boyle recently made a whole
video about what's going on over there,
so I will leave a link to his extensive
breakdown if you are interested. But the
point is that the market is not
infallible, it's just smarter than you
are. This video more than any other has
a potential to age horribly, but it is
worth acknowledging that you are not
seeing something that the collective
wisdom of the market has missed by
pointing out that this all looks a
little bit like a bubble. It knows. It's
just that the people with more voting
power like the other arguments a little
more for now.
So in the meantime it's worth at least
understanding what those arguments are.
But if you want a counter argument, we
have compiled all of the problems into a
rather extensive video over on our
compilations channel. So go and check
that out next and don't forget to like
and subscribe to keep on learning how
money works.
Interactive Summary
Ask follow-up questions or revisit key timestamps.
The video explores the current state of the stock market, addressing concerns that it may be in a bubble due to record-high valuations, economic headwinds like inflation and debt, and extreme concentration in a few large companies. It compares the current situation to the dot-com bubble, arguing that while there are risks, today's market leaders have stronger fundamentals. Ultimately, the video suggests that the market continues to climb not because it is blind to these risks, but because major investors—who control the vast majority of capital—lack better alternative investment opportunities and are utilizing leverage to maintain their positions.
Suggested questions
3 ready-made promptsRecently Distilled
Videos recently processed by our community